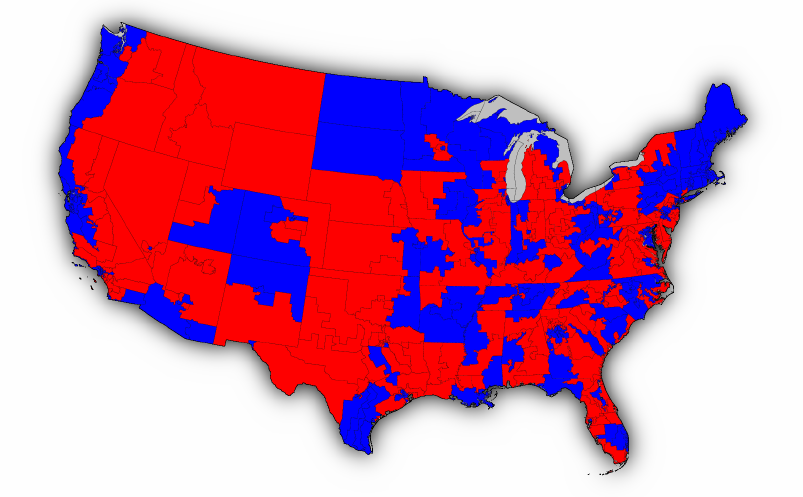
Click on the map to see a larger version

In this map each congressional district is shown either in red or blue to indicate whether the district was won by the Republican or Democratic candidate respectively. (By an odd twist of recent electoral history, the accepted color scheme for the left- and right-leaning parties in the States is the opposite of what it is in most other countries, with red indicating right-wing not left.)
While maps like this are certainly interesting and useful, they are in some respects difficult to read. In particular, since the map above contains much more red than blue it gives the superficial impression that the Republican party dominated the election, when in fact the reverse is true – the Democrats won a significant majority of districts and with them the control of the House of Representatives. The source of the problem, as many people have pointed out, this is that the map fails to take account of the widely varying population densities of the various districts. This map shows the population density of the country, and it's easy to see that the population is far denser in some places (the light areas) than others (the dark areas):

Because densely populated areas of the country tend to vote Democratic, the "blue" districts occupy smaller area on average, but they are nonetheless large in terms of numbers of people, which is what matters in an election. We can correct for this by making use of a cartogram, a map in which the sizes of districts are rescaled according to their population. That is, districts are drawn with a size proportional not to their sheer topographic acreage – which has little to do with politics – but to the number of their inhabitants, districts with more people appearing larger than districts with fewer, regardless of their actual area on the ground.
Here are the 2006 House election results on a population cartogram of this type:

This map makes it clear that the numbers of people in Republican and Democratic areas are in fact not so far apart, and where the first map above makes it seem as though there is far more red than blue this one allows one to see how the votes fall in terms of actual population.
The actual number of Representatives in the House from each party however does not depend on how many people there are in each congressional district: by definition there is one representative per district. If one wants to be able to see at a glance which party has a majority in the House, therefore, a slightly different cartogram is appropriate, one in which we rescale the size of each congressional district to be the same. Here is such a cartogram for the 2006 election:

In this map each district is the same size, so the total area of red is simply proportional to the total number of Republican Representatives and similarly for the total area of blue. In fact, this map is not so different from the previous one: the whole point of congressional districts is to try and divide the country up into parcels of roughly equal population, so if we have done it right the population cartogram should give equal area to each congressional district.
Can we do the same thing for the Senate? We can, but it's a little more difficult. Senators are elected by popular vote in their state and hence one could in principle make a map in which states were colored according to the results of the corresponding vote. However, under the US electoral system voters don't vote for the entire Senate in each election, as they do for the House of Representatives. Instead, senators have six year terms and a only third of Senate seats come up for election every two years. Thus in 2006 there were elections for 33 out of the 100 seats in the Senate and hence only 33 out of the 50 states had senate votes. If we want to make a map, therefore, we have to decide what to do with the remaining states.
There are several ways one could go with this, but as a representation of the state of the country I find it useful to fill in all the states, using not just the party affiliations of the senators elected in 2006, but putting in all the senators. This however introduces its own problems because there are two senators per state and some states are represented by one Republican and one Democrat. (There are 15 such states at present.) To represent this state of affairs, I've colored states blue, red, or purple, thus:
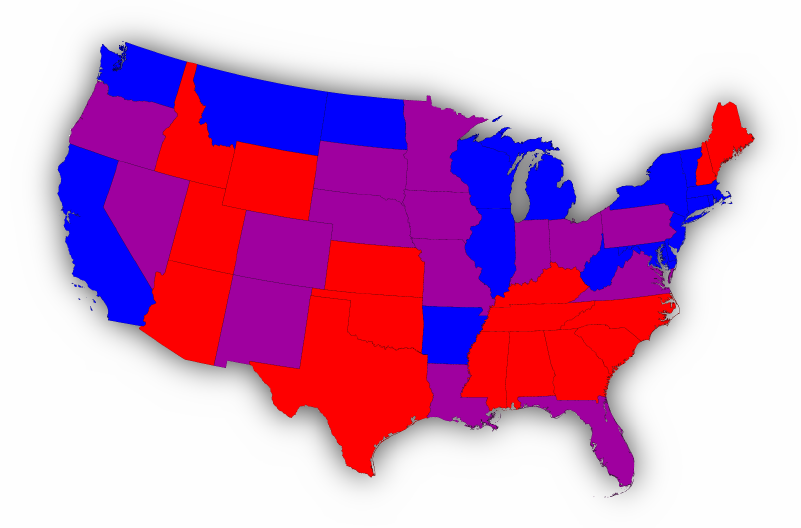
As before, the actual areas of the different colors doesn't reflect the distribution of the population but we can correct this by redrawing the map as a cartogram. The result looks like this:
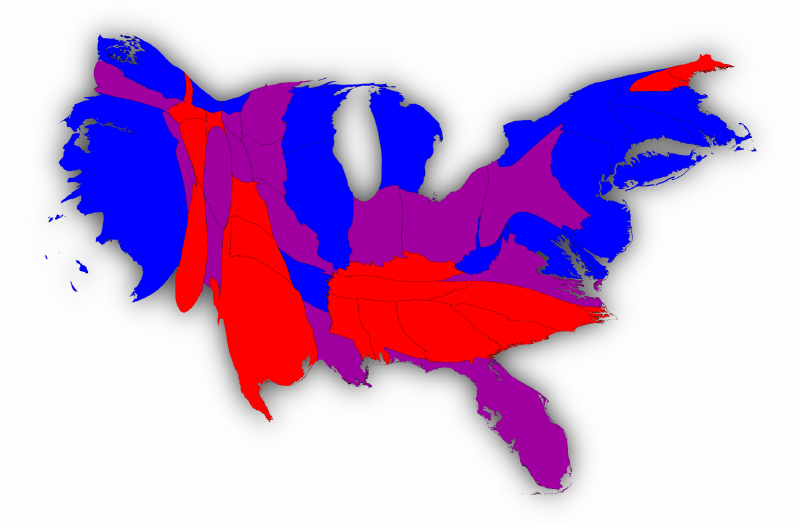
This map appears to have more blue than red, which is not an illusion: it reflects the fact that although there are only slightly more senators in the Democratic caucus than the Republican one (51 versus 49), the number of people in blue states significantly outnumbers the number of people in red ones, because the blue ones have higher populations on average. Using the latest figures from the US Census, for instance, we find that the total population of blue states is 167.9 million people, while the total population of red states is 125.2 million. (In this calculation, I split the populations of the purple states 50:50.)
Thanks: Thanks to K. Pizzini for suggesting the cartogram with equal areas for the districts.
Alaska and Hawaii: Alaska and Hawaii are missing from the maps because I don't have gridded population data for these states. If anyone knows where such data are available (for free) at the 0.5 arc-minute resolution level or better, please drop me a line.
Data: If you are interested in the raw data for the election winners, I've put Excel spreadsheet files here: House, Senate. Some of the election winners were provisional at the time I made these maps. The results may have changed slightly by the time you read this.
Technical details: The cartograms on this page were made using the cart software package, which implements the Fourier-transform-based cartogram technique of Gastner and Newman. The cartograms were calculated and rendered on a 4608×3072 grid and the calculations took about half an hour on a standard desktop computer running the Fedora Linux operating system. The basic images were created using a specially written rendering program and some artistic refinements, such as the drop-shadows, were added using Gimp, a free image manipulation program. Population data came from the 2000 US Census, as did data for the boundaries of the states and congressional districts.
© 2006 M. E. J. Newman
The views expressed on this page are personal and are not necessarily shared by the University of Michigan.
Mark Newman, Department of Physics and Center for the Study of Complex Systems, University of Michigan