Analyzing an Electrocardiogram (ECG) using Wavelets and Fourier Transforms
The challenge at hand is how effectively an ECG can be analyzed utilizing Wavelets, the Fourier Transform, and various filters. From these various processes, is it possible to denoise, detrend, and filter in order to reveal characteristics such as BPM, arrhythmia, and other various conditions of the heart. From the findings, it appears that these goals are able to be completed.
ECG Background
An electrocardiogram, ECG for short, measures the electrical activity of the heart. Recently in 2009, ECG abnormalities were extensively quantified using the Minnesota code, a way to describe ECG variations with digital quantification. This publication by Prineas, Crow, and Zhang1 provides a refined Minnesota code which is being expanded to be used in a wider variety of diagnoses.
[1]Prineas, Ronald J., Richard S. Crow, and Zhu-Ming Zhang. The Minnesota Code Manual of Electrocardiographic Findings, including Measurement and Comparison with the Novacode: Standards and Procedures for ECG Measurement in Epidemiologic and Clinical Trials. London: Springer, 2010. Print.
Technical ECG Background
An ECG is done using 10 electrode leads placed outside of the body. Six leads are placed around the heart to get an accurate measurement of the voltage across different planes of the heart. The remaining four are placed on the limbs. A full ECG yields much initial diagnostic that is useful as an initial diagnostic tool, not as a final diagnostic tool. That is, the ECG is useful to screen a patient of certain heart disorders.
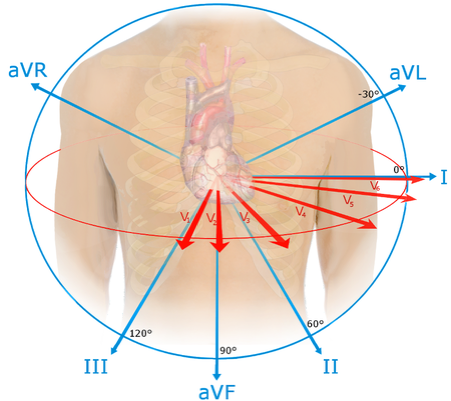
Figure 1: ECG information
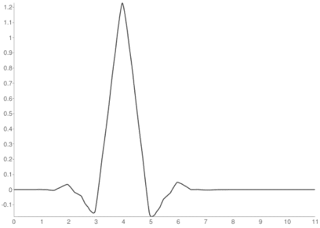
An typical heart pulse can be generalized as a depolarization of atria, a depolarization of ventricles, and then a repolarization of both. The repolarization of the atria and the depolarization of the ventricles happens in a similar time frame and ventricular depolarization obscures the former.
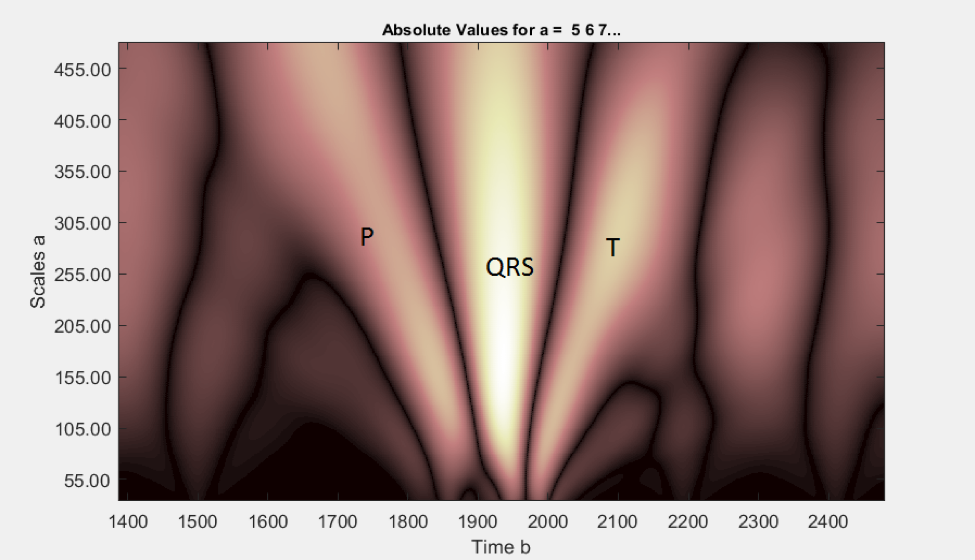
A heart pulse has distinct timings and amplitudes. A cartoon depiction of a generic signal is shown in Figure 2.
P – Atrial depolarization
QRS – Ventricular depolarization
T – Ventricular repolarization
The QRS complex is a very important point – it detects the strength and speed of contraction. This part of the ECG is very useful for diagnosing cardiac integrity. For example, different types of tachycardia either have broader or narrowed QRS complexes.
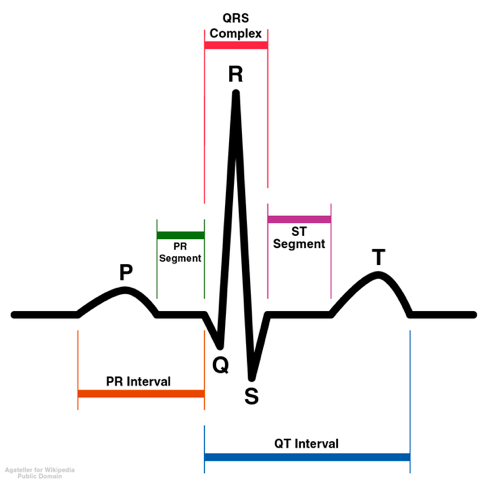
Figure 2:
Source: http://heart.bmj.com/content/86/5/579.full
Purpose
The team saw this opportunity to explore the potential of using DSP tools learned in EECS 351 to analyze ECG signals. Small publications about software ECG processing have been released but nothing detailing complete algorithms have be published. It is increasingly important that ECG processing becomes automated as the Minnesota code has been improved. Right now the technology has not caught up to the capabilities of the code.
The focus of the project is to test the feasibility of various transforms. Rather than attempt to diagnose heart conditions, the team focused on processing ECG signals and employing machine learning to extract components of the signal. Once each individual complex can be removed, characterization can be done.
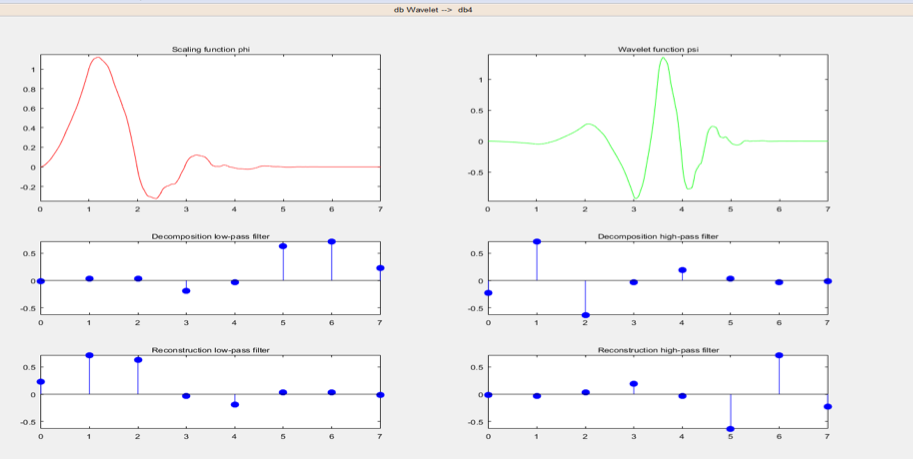
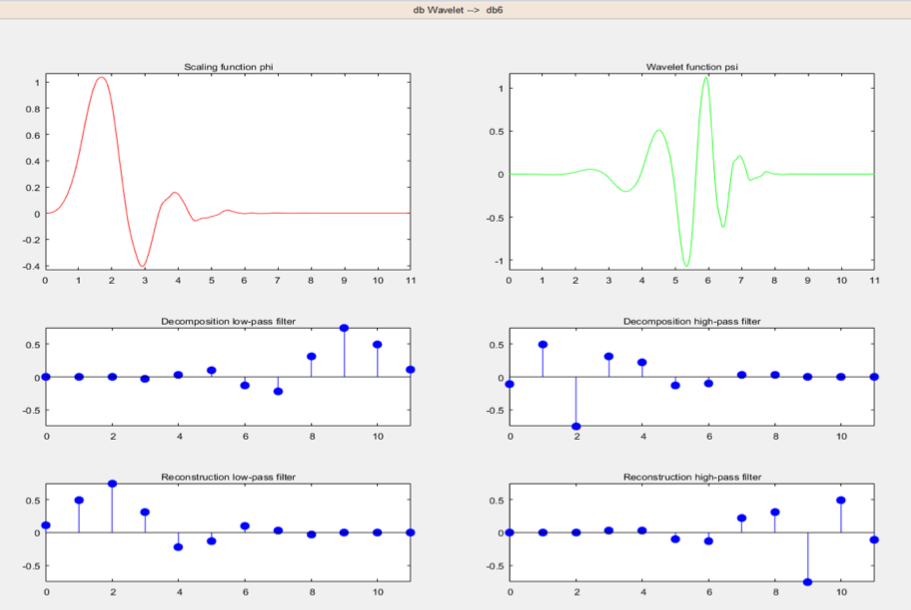
From previous works and suggestions from Prof. Balzano, wavelets were chosen as our primary tool of analysis. Four wavelets were evaluated: coiflets, haar, mexican hat, and daubechies.
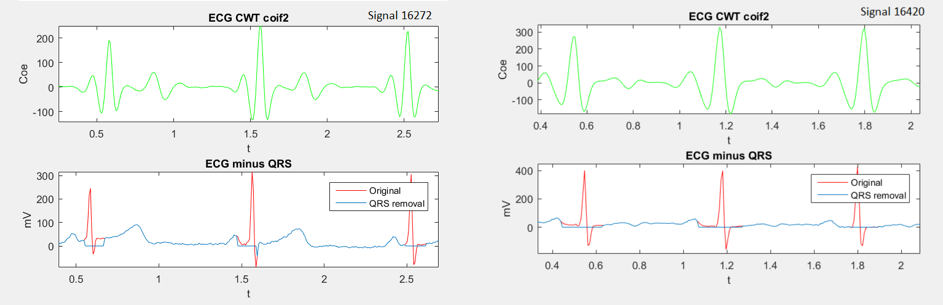
An initial attempt to analyze all 12 signals and compare them to each other was made. Figure X shows a general depiction of each signal. However, the number of combinations shifted the focus more on understanding the physiology of the heart rather than analyzing ECG signals. A focused analysis on signal 1 was done instead after an initial attempt to process all 12 signals. 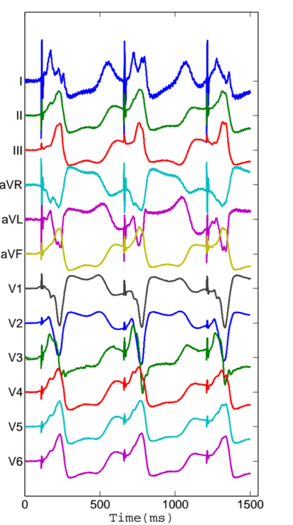
Figure 3: 12 Lead ECG Signal
Wavelets
Overview
Wavelets are similar to the Continous Fourier Transform (CFT) in the sense that convolution is used and the resulting transform is the correlation of the original signal and the convolved signal.
In the Fourier Transform, the convolved signal are sinusoids of different frequencies. This gives the frequency representation of the original signal.
In the Fourier Transform, the convolved signal are sinusoids of different frequencies. This gives the frequency representation of the original signal. As seen in figure 4, the coefficients are plotted on the y axis, giving the magnitude of correlation and the frequency is plotted on the x axis.
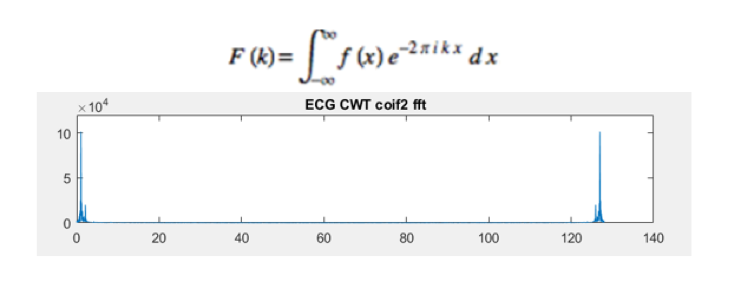
Figure 4: Fourier Transform and Plot
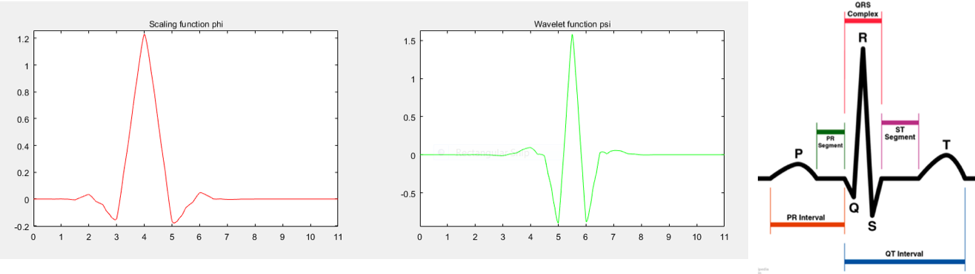
In the Wavelet Transform, the convolved signal, the mother wavelet, is not a set function like the Fourier Transform. This makes the Wavelet Transform a more versatile tool as the mother wavelet can change for each application. There are many different types of wavelets; in this project, coiflets, daubachies, Mexican hat, and haar wavelets are evaluated and each are unique signals.
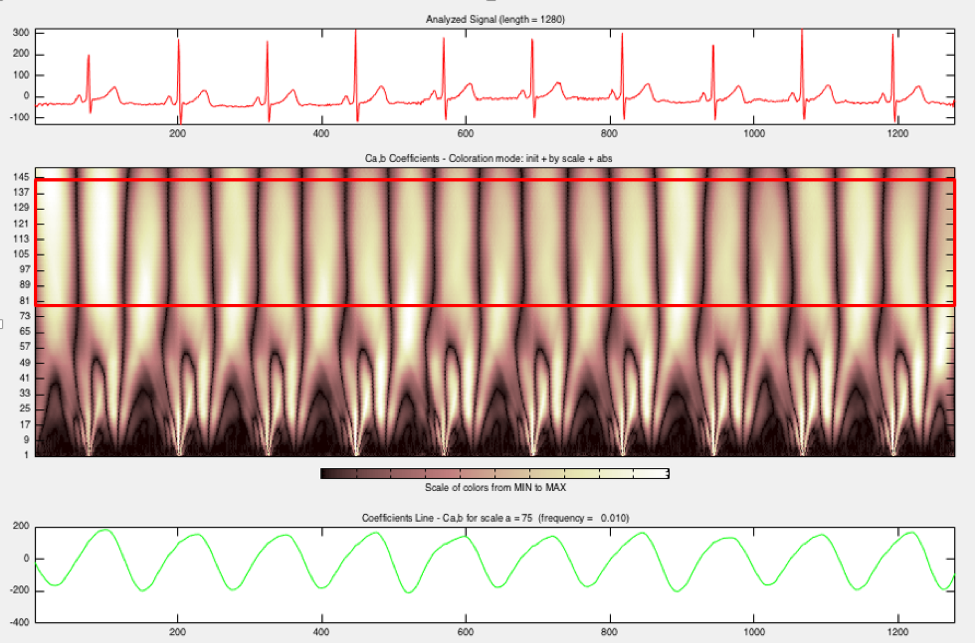
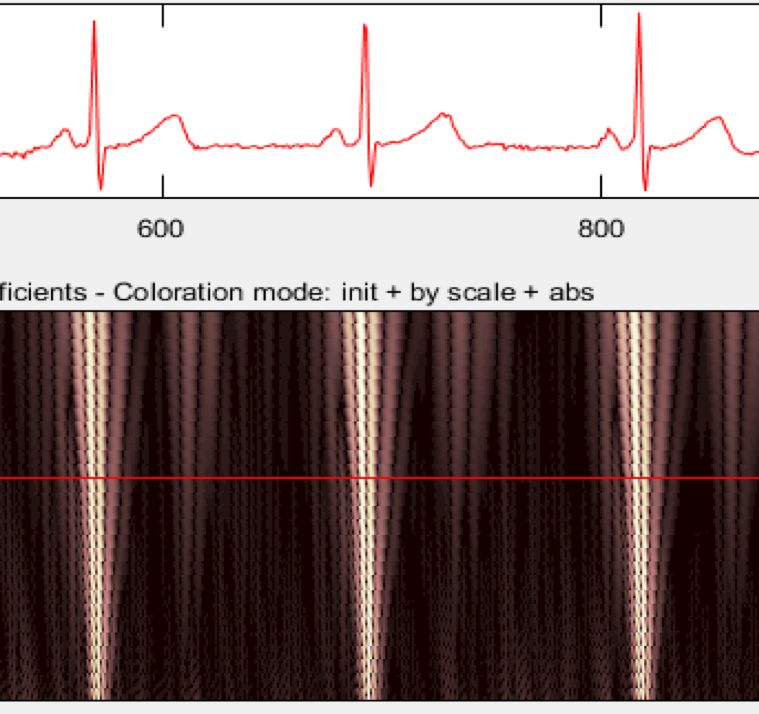
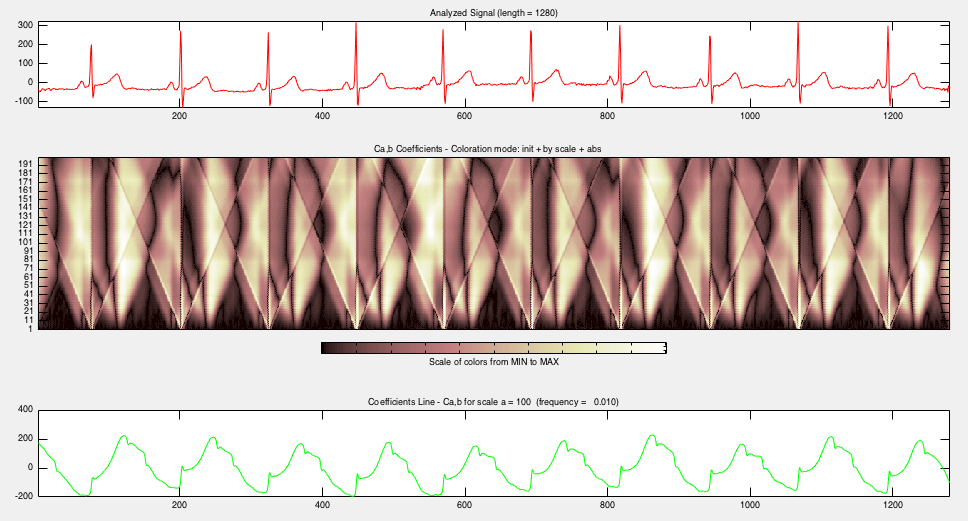
Another aspect of the wavelet transform is the scaling function. A scaling function will increase the duration of mother wavelet in the time domain and this is controlled by the scale value. Analysis of the wavelet transform can be done via a 2D graph shown in figure 5. The scale is plotted on the y axis, the coefficient magnitude is plotted on the z axis, and time is plotted on the x axis. This is because the transform has good time resolution at small scales which is explained in the next section.
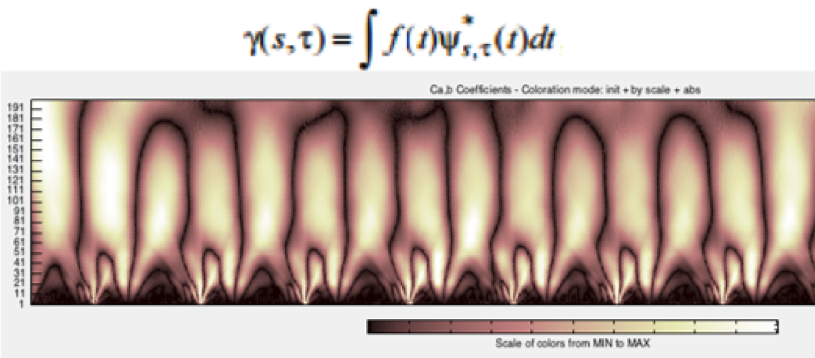
Figure 5: Wavelet Transform Equation and Coefficient Plot
The Uncertainty Principle
As stated above, the mother wavelet can vary in length in the time domain.
This is useful when one recalls the uncertainty principle of signal processing: the frequency and time of a signal cannot be simultaneously known. In order to gain a better time representation, the frequency is sacrificed and vice versa.
In the Fourier Transform, windowing is used to segment the time domain. In the wavelet domain, a separate scaling function is used to “widen” the mother wavelet. Namely, at higher scales, the duration of the mother wavelet is longer. Therefore there is better frequency representation but worse time representation.
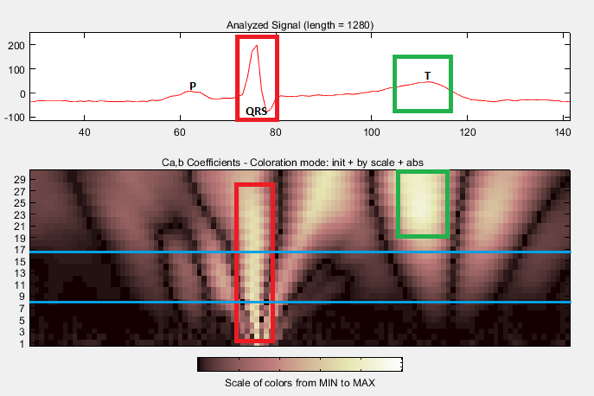
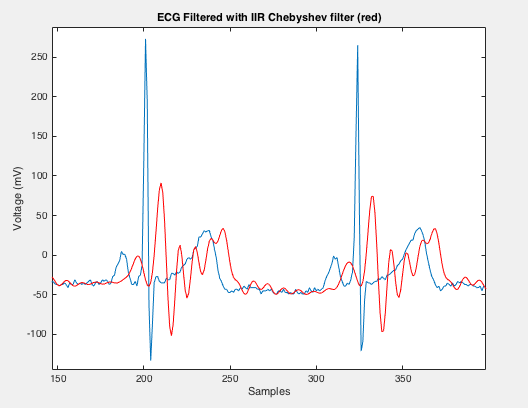
This is useful when selecting for features. In an ECG application, the windowing period of the Fourier transform should be similar to the duration of a heartbeat. In figure 6, the difference between different scales is clear. The scaling factor is plotted on the y-axis. At high scales. Indicated by the red box, the duration of the mother wavelet is long and the underlying sinusoid of the ECG is being extracted. If the big R peak is to be extracted, lower scales, indicated by the blue box, are much better to use.
When even smaller features are to be extracted, such as the QRS complex, even smaller scales need to be used.
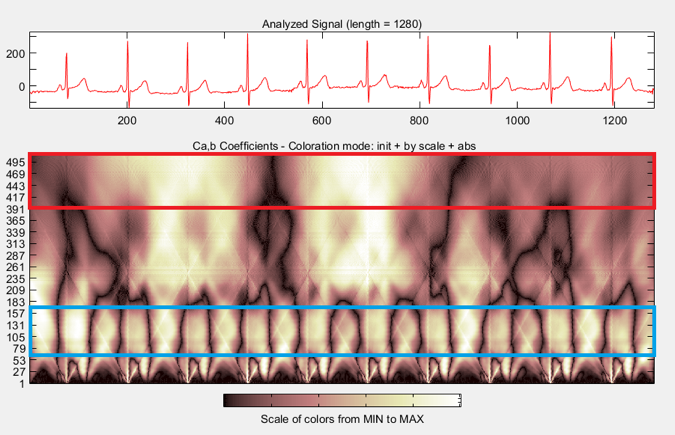
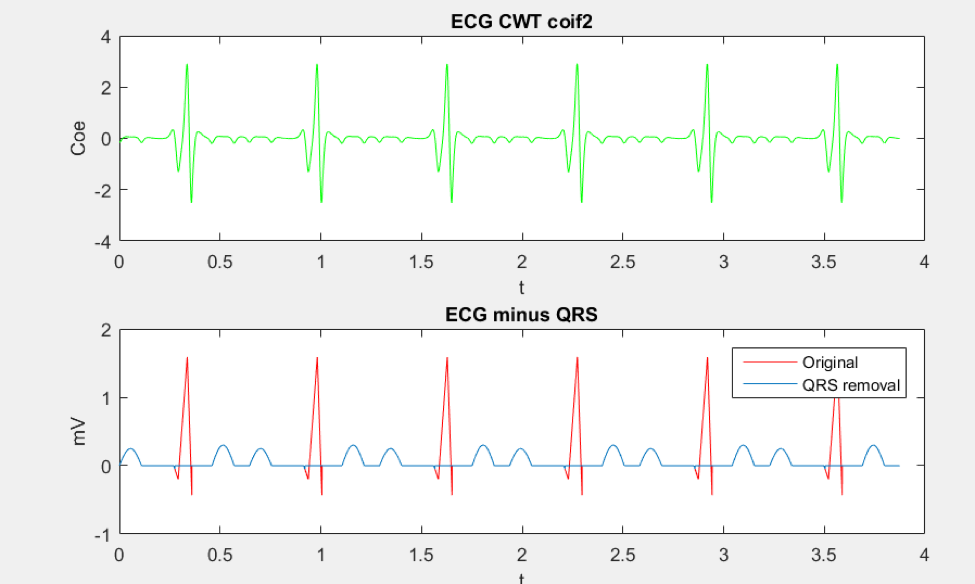
Figure 6: Coif2 Wavelet Coefficient Plot
Goals
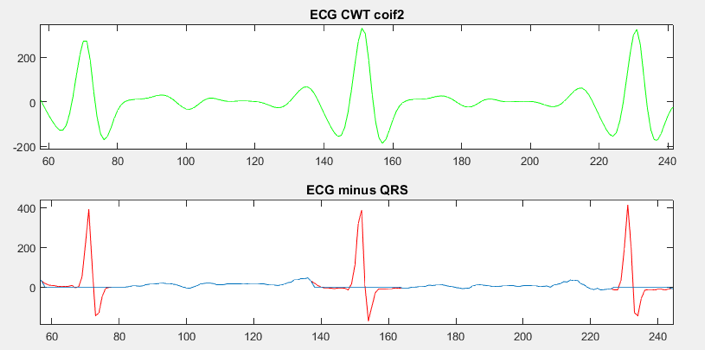
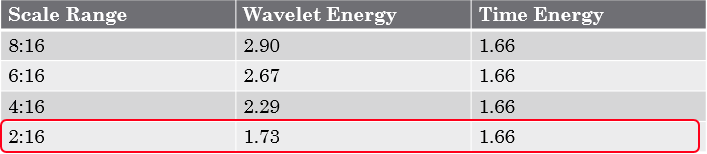
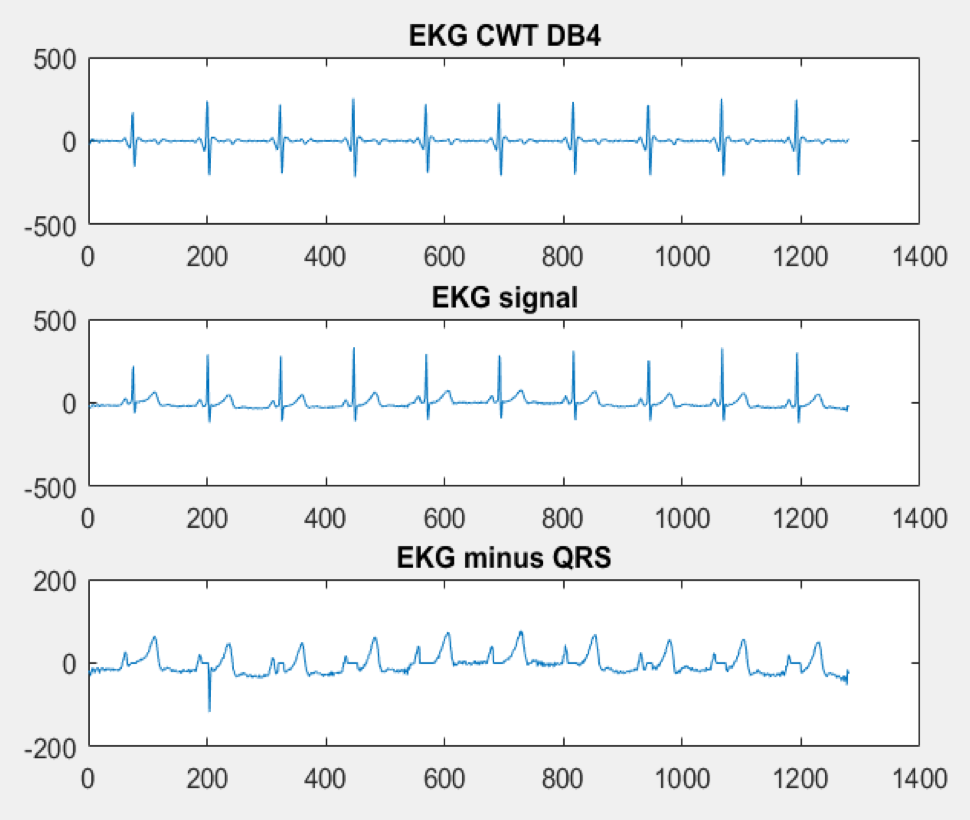
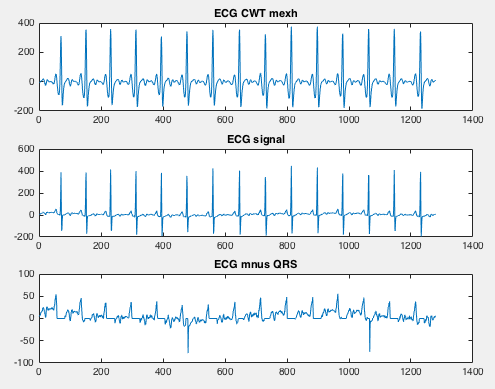
To test the feasibility of each wavelet, the goal is to extract the QRS complex from the signal autonomously.
The QRS signal must be the first aspect because it is of the highest frequency. The P and T peaks are also important but are always of lower frequency because of the slower speed of membrane repolarization and atrial constriction. Additionally, the QRS yields the most diagnostic information. The QRS complex corresponds to ventricular polarization which directly correlates to the strength of the heart to pump blood to the rest of the body.
Once the QRS complex is extracted, then the two remaining peaks are the P and T peaks which could be easily extracted another algorithm. Therefore IF the wavelet can extract the QRS complex, that wavelet can be useful in ECG processing.
Return to top