-
- CSCAR
- The University of Michigan,
- 3554 Rackham Building
- 915 E. Washington St.
- Ann Arbor, MI 48109-1070
As of August, 1, 2014, I officially retired from CSCAR, which is now known as Consulting for Statistics, Computing, and Analytics Research, (formerly the Center for Statistical Consultation and Research) at the University of Michigan.
Check out our book!
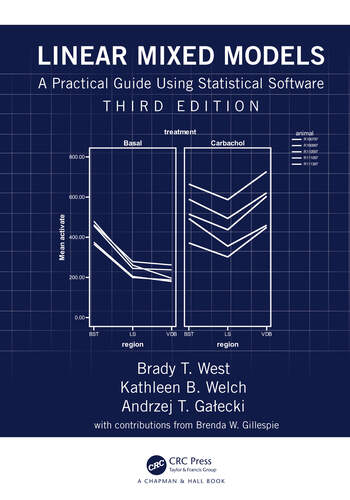
I am co-author of a book published by Chapman & Hall/CRC Press, the third edition of which came out in 2022, Linear Mixed Models: A Practical Guide using Statistical Software, Third Edition with Brady West from CSCAR and Andrzej Galecki from the Institute of Gerontology at the University of Michigan. This book describes how to carry out an analysis of clustered, longitudinal, or repeated measures data sets using linear mixed modeling (LMM) procedures in SAS, SPSS, Stata, R, and HLM. The data sets analyzed in the book were mostly from clients with whom we have consulted at CSCAR, and show how real-world problems can be approached with widely used software. We provide descriptive statistics and basic graphics for each data set, model-building strategies, and step-by-step information on how to analyze each data set with each software procedure, including the appropriate syntax, and a comparison of the models fitted using each procedure. We also provide an overview of the theoretical concepts involved in LMMs. A new chapter on crossed random effects models was added in the second edition, and a chapter on sample size calculation for Linear Mixed Models was added to the third editionalong with updates to the software code for graphics and analysis. You can check the LMM book web page that Brady maintains for data sets and up-to-date syntax for each of the software packages.
My home page has resources for the workshops and courses that I either taught, co-taught or assisted in teaching, and some graphics on how to import an Excel Spreadsheet into SAS. There are also some fun pictures at the end of this page.
A web page listing some of my professional qualifications is available, if you Click here.
Introduction to SAS Workshop
The Introduction to SAS Workshop is presented by CSCAR.
Workshop materials including, SAS datasets, SAS command files, and raw data files can be found here:
- labdata.zip Save this archive containing data sets and SAS command files on the desktop. Extract the files to a folder on your desktop called "Labdata". It will be used as the current folder by SAS. It will not work properly unless the files are unzipped.
- sasdata2.zip Permanent SAS data sets which will be used in the workshop. Download this zip file to your desktop and extract the files to a folder called "Sasdata2". It will not work properly unless the files are unzipped.
- commands.zip This archive contains the SAS commands that will be used in the workshop. They are also contained in the labdata.zip archive, but are kept here for reference. You will not need to download this archive for the workshop. but can keep the files in it for your own use.
Workshop assignments can be found here:
- Assignment 1.docx This assignment is an exercise in opening and submitting a SAS command file, and getting output.
- Assignment 2.docx This assignment is an exercise in obtaining simple descriptive statistics using SAS.
Other useful information can be found here:
- fonts.sas This code snippet will make your SAS listing output look good when printed from any computer, whether it has SAS loaded on it or not. It changes the SAS font that is normally used to a more generic font. This will get rid of the funky-looking little row, such as fffff for a line in the output for tables, etc. If you are using SAS listing output, submit this line of code at the beginning of your SAS session whenever you run SAS. If you are only using HTML output, you will not need this code snippet.
Biostatistics 600
In class handouts and the SAS commands that go with them can be found here:
- A_Brief_Tour_of_SAS_B600_2015.pdf This handout goes over how to navigate the SAS windows environment, read in raw data and make simple data transformations, and carry out simple descriptive statistics using SAS.
- brieftour.sas Commands for the brief tour of SAS handout.
- B600_Statistical_Graphics_2015.pdf This handout illustrates how to generate boxplots, barcharts, scatterplots, series plots, and some others, using SAS graphics.
- stat_graphics.sas This SAS command file goes along with the handout on how to generate statistical graphics using SAS.
- B600 Overview of Data Management Tasks 2015.pdf This handout illustrates how to carry out commonly used data management tasks using SAS, including creating subsets of data, dropping cases, and dropping variables, selecting cases for analysis, sorting, and merging files.
- datamgt.sas This SAS command file goes along with the handout on how to carry out simple data management tasks using SAS.
- B600_Statistical_Procedures_2015.pdf This handout illustrates how to carry out commonly used statistical procedures in SAS, including t-tests, chi-square tests for contingency tables, correlation, linear regression, logistic regression, Poisson regression, and some non-parametric tests
- statistical_tests.sas This SAS command file goes along with the handout on how to carry out statistical procedures using SAS.
Zipped archives containing the files to use in the Biostat 600 SAS lab can be found here:
- labdata.zip Zipped archive containing Blank delimited (.dat) files, Comma delimited (.csv) files, Tab delimited (.txt) files, Excel (.xls) files, SPSS portable (.por) files, and SPSS datasets (.sav files). Save this archive on the desktop, and then unzip it to a folder called labdata on your desktop.
- sasdata2.zip SAS version 9 data sets (.sas7bdat).
Supplemental materials can be found here:
- fonts.sas This little SAS command file contains a line of code that will make your SAS output look good when printed from any computer, whether it has SAS loaded on it or not. It changes the SAS font that is normally used to a more generic font. This will get rid of the funky-looking little row, such as fffff for a line in the output for tables, etc. Submit this line of code at the beginning of your SAS session whenever you run SAS.
- graph_template.sas This little SAS command file illustrates how to set up a SAS/Graph template to make your font size larger when creating graphs using SAS Statistical Graphics.
- read_NA_as_missing.sas This little SAS command file shows how you can read "NA" as a missing value when importing data from a .csv file generated by R into SAS.
- SAS_Functions.doc This link to a portion of the SAS documentation gives a listing of SAS functions from SAS release 9.2.
- B600_Supplement.pdf This is a packet that contains more detailed information how to read instream data, how to read raw data from different types of files, and how to work with dates in SAS.
- instream.sas Commands for reading instream data into SAS.
- readdata.sas Commands for reading raw data in many different forms into SAS.
- dates.sas Commands for reading in and setting up dates in SAS.
Homework Exercises can be found here:
- B600_Exercise1_2015.doc This is an exercise on reading in raw data using SAS and getting basic descriptive statistics.
Epidemiology 759: Introduction to SAS
I teach a week-long course on Introduction to SAS, Epidemiology 759, in the Graduate Summer Session in Epidemiology, at the University of Michigan School of Public Health.
Zipped files for use with the workshop can be downloaded here:
- labdata.zip Zipped archive containing SAS command files and raw data files that go with the Workbook. Download this archive to your desktop and then double-click to extract the files from the archive to a folder called "labdata" on your desktop.
- sasdata2.zip SAS version 9 data sets (.sas7bdat) to be used as examples in the course.
- ExerciseDataSets.zip Data sets to be used for the exercises. Download this archive to your desktop and then double-click to extract the files from the archive to a folder called "ExerciseDataSets" on your desktop.
General handouts can be found here:
- fonts.sas This tiny SAS command file contains a line of code that will make your SAS listing (plain text) output look good when printed from any computer (it will get rid of the funky-looking little row, such as fffff for a line in the output for tables, etc.) whether you have SAS installed on that computer or not. Submit this line of code at the beginning of your SAS session whenever you run SAS.
- SAS_Functions.doc This link to a portion of the SAS documentation gives a listing of SAS functions from SAS release 9.2.
Command files generated in class that you may want to use can be downloaded here:
- import_data.sas This command file gives SAS commands to import a Stata file, an SPSS data set, and an Excel file. Remember, you can use the Import Wizard for both Stata and SPSS data sets, but you need to submit the commands to import an Excel file.
- saveperm_revised.sas
- useperm_revised.sas
- Steps_when_starting_sas.docx Basics of getting started with SAS.
Exercises using SAS can be downloaded here:
- Workshop Exercise 1.docx
- Workshop Exercise 2.docx
- Workshop Exercise 3.docx
- Workshop Exercise 4.docx
- Workshop Exercise 5.docx
- Workshop Exercise 6.docx
Exercises solutions can be downloaded here:
- Exercise1_key.sas
- kbw_exercise1.sas This command file shows the commands used for exercise one in the summer 2015 session.
- exercise1_revised_key.sas
- Exercise2_key.sas
- Exercise3_key.sas
- Exercise4_key.sas
- Exercise5_key.sas
- Exercise6_key.sas
Biostatistics 512: Analysis of Clustered and Longitudinal Data Using Statistical Software
Selected In-Class materials can be found here:
- LMM Intro.pptx This PowerPoint presentation gives an introduction to Linear Mixed Models.
- Clustered_TwoLevel_A.pptx This PowerPoint presentation gives an introduction to two-level clustered data analysis using a Linear Mixed Model.
Introduction to SAS Proc Mixed: CSCAR Workshop
The Introduction to Proc Mixed (Longitudinal and Clustered Data) Workshop is presented by CSCAR.
Click here to link to a web page where you can download the data sets and SAS commands for the labs for the Proc Mixed Workshop.
HLM: Applications of Hierarchical Linear Models for ESIN
Instructions for using these data files:
- First, create a folder on your desktop called HLM.
- To download a file using Internet Explorer, right-click on the file and select "Save Target As..." and place the file in the HLM folder on your desktop. Do not double-click on the file, or it will open up looking very weird (because it is a binary file).
- To download a file using Mozilla Firefox, right-click on the file and select "Save Link As..." and place the file in the HLM folder on your desktop. Do not double-click on the file, or I.E. will attempt to open it using SPSS.
- HSB1.SAV High School and Beyond (Two-Level Clustered Data Example) Level 1 Dataset Click here and download to your desktop.
- HSB2.SAV High School and Beyond (Two-Level Clustered Data Example) Level 2 Dataset Click here and download to your desktop.
- VOCAB1.sav Vocabulary Acquisition (Two-Level Longitudinal Data Example) Level 1 Dataset Click here and download to your desktop.
- VOCAB2.sav Vocabulary Acquisition (Two-Level Longitudinal Data Example) Level 2 Dataset Click here and download to your desktop.
- EG1.SAV Chicago Public Schools (Three-Level Data Example) Level 1 Dataset Click here and download to your desktop.
- EG2.SAV Chicago Public Schools (Three-Level Data Example) Level 2 Dataset Click here and download to your desktop.
- EG3.SAV Chicago Public Schools (Three-Level Data Example) Level 3 Dataset Click here and download to your desktop.
- UTHAI1.SAV Thai Retention (Binary Two-Level Clustered Data Example) Level 1 Dataset Click here and download to your desktop.
- THAI2.SAV Thai Retention (Binary Two-Level Clustered Data Example) Level 2 Dataset Click here and download to your desktop.
ICPSR: Brief Tour of SAS
- sasdata2.zip zipped file containing a bunch of SAS datasets Click here and download to your desktop, and unzip to a folder called sasdata2.
- labdata.zip zipped file containing SAS commands, plus raw data and Excel files for the brief tour of SAS Click here and download to your desktop, and unzip to a folder called labdata.
Missing Data Workshop
The Statistical Analysis with Missing Data Workshop is presented by Professors Roderick Little and Trivellore Raghunathan from the University of Michigan Department of Biostatistics, along with CSCAR staff.
Data and commands for the afternoon lab sessions can be found here
- lsoa_86x.sas7bdat This SAS dataset is used for the afternoon lab examples. Right-click on this file, and download it to a folder on your desktop called LAB (you will need to create the lab folder before you can download files to it).
- missingdata_session1.sas SAS command file for the first afternoon lab session. Download this file to the lab folder that you created on your desktop.
- missingdata_session2.sas Command file for the second afternoon lab session using IVEware called from SAS. Download this file to the lab folder that you created on your desktop.
Biostatistics 510: Statistical Computing Packages
I teach Biostat 510 in the Biostatistics Department at the University of Michigan School of Public Health . We cover simple data management tasks and basic statistical techniques using the statistical software packages, SAS and SPSS.
The Final Project for 2010 can be found here:
- Click here to get the Final Project assignment, plus datasets for each class member, and instructions on how to proceed with the final project for 2010.
General Handouts can be found here:
- syllabus_2010.doc The course syllabus gives information on topics to be covered, homework assignments, and the final project.
- Import_Excel.doc This document gives information on how to save an Excel file for use with a statistical package and how to import it into SAS.
- fonts.sas This little SAS command file contains a line of code that will make your SAS output look good when printed from any computer (it will get rid of the funky-looking little row, such as fffff for a line in the output for tables, etc.) whether you have SAS installed on that computer or not. Submit this line of code at the beginning of your SAS session whenever you run SAS.
- SAS_Functions.doc This link to a portion of the SAS documentation gives a listing of SAS functions from SAS release 9.2.
In-Class handouts for 2010 can be found here.
- Click here to get In-Class Handouts for 2010.
Homework assignments for 2010 can be found here.
- Click here to get to the homework assignments for 2010.
Data sets and commands that accompany the Course Pack can be found here:
- b510_data.zip Archive containing raw data sets, Excel file, tab-delimited data, comma separated values (.csv) files, and SPSS portable files that may be read into SAS.
- b510_sas_commands.zip Archive containing SAS commands that go along with each chapter in the course pack.
- sasdata1.zip SAS version 6 data sets (.sd2)
- sasdata2.zip SAS version 8/9 data sets (.sas7bdat and .sd7)
Information on Biostat 510 from last year.
- Click here for information on Biostat 510 for Winter 2009.
Regression Analysis Workshop
The Regression Analysis Workshop is offered by CSCAR.
Data Sets for lab examples:
SAS commands and the dataset for Box-Cox transformations are included below:
- boxcox.sas SAS commands to figure out a good transformation for Y, using the Box-Cox method.
- cars.por SPSS portable file to use in Box-Cox transformations example.
- model_selection.sas SAS commands for model selection methods, including All Possible Regressions, Mallow's CP, and Adjusted R-Square.
- fitness.por SPSS portable file to use in example of model selection methods using SAS.
Statistical Graphics Using SAS 9.2
This two-hour workshop gives information on how to create simple statistical graphics, including boxplots, barcharts, histograms, scatterplots, loess fits, and scatterplot matrices using SAS 9.2.
Handouts and command files used for the workshop can be found here:
- Statistical_Graphics.doc This handout shows examples of how to create some common statistical graphs using SAS 9.2.
- sgraphics.sas SAS command file to be used with the handout: Statistical_Graphics.doc.
- ODS Graphics Using SAS.doc This handout shows examples of how to use the SAS ODS system to create graphics for some common statistical procedures in SAS 9.2.
- ods_graphics.sas SAS command file that shows how to get ods graphics with various statistical procedures in SAS.
Datasets used for the workshop can be found here:
- employee.sas7bdat SAS dataset to be used in the SAS graphics workshop.
- afifi.sas7bdat SAS dataset to be used in the SAS graphics workshop.
- autism.csv comma separated raw data file to be used in the SAS graphics workshop.
Meta-Analysis Workshop
The Meta-Analysis Workshop is presented by staff of the University Library and CSCAR.
- bcg2.dta Click here to download the Stata datafile which can be used for the in-class examples checking for publication bias and odds ratios across studies.
- dmfs.dta Click here to download the Stata datafile which can be used for the in-class examples on combining estimates of means and standard deviations.
- bcg.sas Click here to download the SAS commands which can be used to analyze the bcg data example.
Introduction to SAS for Stat Dept
The Introduction to SAS Workshop is being offered by CSCAR at the Statistics Department April 4th, 5th, and 11th. Instructors are Kathy Welch and Heidi Reichert.
Files for the workshop can be found here:
- workshop_command_files.zip
- workshop_data_files.zip
- H06A_H.da H06A_H.da data file from the HRS study.
- H06A_H.sas SAS commands to read in the H06A_H.da data file.
- H06A_R.da H06A_R.dat data file from the HRS study.
- H06A_R.sas SAS commands to read in the H06A_R.da data file.
- SAS_Functions.doc This document gives a listing of SAS functions from SAS release 8.2.
- macro_random_sample_steps.sas SAS commands illustrating the steps in creating a macro to generate random samples from a dataset.
Arbor Research Proc Mixed Workshop (November, 2007)
This workshop uses examples from our new book Linear Mixed Models: A Practical Guide using Statistical Software. The data sets and examples used in the book are included on this web page: Web page for Linear Mixed Models Book where you can also get information on a 20% discount on the book.
Workshop examples and data sets are included in the zipped file below:
- procmix.zip this zipped file contains data sets and SAS commands used in examples for the Workshop. Download and unzip this archive to a folder on your desktop called procmix.
- ratpup_diagnostics.rtf this rtf file contains SAS ODS output from an analysis of the Rat Pup data using SAS Proc Mixed, along with diagnostic plots and the experimental influence diagnostics available in SAS 9.1.3.
SAS Data Step Workshop for Arbor Research
This workshop covers parts of the CSCAR Intermediate SAS Workshop presented in the fall semester.
- labdata.zip this zipped file contains data sets and SAS commands used in examples for the Workshop. Download and unzip this archive to a folder on your desktop called labdata.
- sasdata1.zip this zipped file contains SAS version 6 data sets (.sd2 extension), and a SAS version 6 formats catalog (formats.sc2). Download and unzip this archive to a folder on your desktop called sasdata1
- sasdata2.zip this zipped file contains SAS version 9 data sets (.sas7bdat and a version 7/8 data set .sd7). Download and unzip this archive to a folder on your desktop called sasdata2
- bostfire_setup.sas this SAS command file contains syntax to read in the data for the Boston Arson Study, so it is ready to be merged.
- bostfire_merge.sas Do you really want to peek?? This SAS command file contains syntax to read in the data for the Boston Arson Study, and merges it. Check this after you have tried to do the merge yourself!
- da9972.bostfire this raw data file contains information about fires in the Boston Metropolitan area.
- da9972.macensus this raw data file contains information on characteristics of Census tracts in the greater Boston area. It can be merged with the Boston Fire data.
- ratbrain.dat this raw data file contains information on activation of a chemical in two treatments (Basal, and Carbachol) and three regions (BST, LS, and VDB) for five rats in Wide format.
- rat_brain_restructure.sas SAS commands to restructure the ratbrain data set from wide to long format.
Financial Engineering: Introduction to SAS
Zipped data files and SAS command files can be downloaded here:
- finan_data.zip Zipped archive containing SAS command files, Excel files, SPSS portable files, etc. Unzip the files in this archive to the c:\temp\finan_data folder.
- sasdata1.zip SAS version 6 data sets (.sd2). Unzip the files in this archive to the c:\temp\sasdata1 folder.
- sasdata2.zip SAS version 8/9 data sets (.sas7bdat) and SAS transport files (.xpt). Unzip the files in this archive to the c:\temp\sasdata2 folder.
General handouts can be found here:
- Preparing Data Using Excel This web page from CSCAR gives an explanation of how to set up an Excel file for use with a statistical package, such as SAS.
- fonts.sas This little SAS command file contains a line of code that will make your SAS output look good when printed from any computer (it will get rid of the funky-looking little row, such as fffff for a line in the output for tables, etc.) whether you have SAS installed on that computer or not. Submit this line of code at the beginning of your SAS session whenever you run SAS.
- SAS_Functions.doc This document gives a listing of SAS functions from SAS release 8.2.
Lecture notes can be found here:
- SAS Key Concepts. This handout gives basic information on using SAS in the Windows environment.
- Simple Descriptive Statistics using SAS. This handout illustrates SAS commands for carrying out basic descriptive statistics for continuous and categorical variables, and some simple graphs, including histograms, boxplots, and scatter plots with regression lines.
- Overview of Data Management Tasks using SAS. This handout gives basic information on using SAS for data management, including tasks such as modifying a data set by adding new variables, recodes of variables, subsetting data, selecting cases for an analysis, etc.
- Basic Statistical Tests using SAS. This handout illustrates SAS commands for basic statistical tests, including one-sample and two-sample t-tests, such as chi-square goodness of fit tests, and chi-square tests of independence, and one-sample and independent samples t-tests.
- Oneway ANOVA using SAS. This handout gives basic information on using SAS for a oneway analysis of variance.
- Paired t-test Using SAS.This handout illustrates how to use SAS for a paired t-test.
- Bivariate Correlation and Multiple Regression Analyses for Continuous Variables using SAS. This handout gives basic information on how to carry out linear regression analyses using SAS, including checking the model assumptions with graphical analysis of residuals.
- Checking for Multicollinearity Using SAS. This handout illustrates using SAS to detect multicollinearity in a multiple regression analysis.
- Regression Models for Binary Outcomes Using SAS. This handout illustrates using SAS for analysis of a binary outcome variable, using a logistic regression model.
- Regression Models for Count Outcomes Using SAS. This handout illustrates using SAS for analysis of a dependent variable that is a count, using a Poisson regression model.
Quizzes and Answer keys can be found here, along with the appropriate SAS code for each quiz.
- Quiz 1.
- Quiz 1 Key.
- SAS code for Quiz 1.
- Quiz 2.
- Quiz 2 key.
- SAS codes for Quiz 2.
- Quiz 3.
- Key for Quiz 3.
- SAS commands for Quiz 3.
Clinical Research Lab
Data Sets and handouts for lab session:
- demo.dta This is the data set we used in the first Stata Session. Right-click on this file to save it to your desktop to the Stata folder.
- IntroStata.pdf This is the handout that Myra presented in the first Stata lab.
- Group123.xls This is the Excel file made from the 3 groups data. Note taht missing values for the numeric variables were indicated by a period (.) in the Excel Sheet.
- Group123.txt This is the text file created from the Excel file above. The text file can be input directly into Stata using the insheet command.
- Exercise_May22.doc This is the *Corrected* exercise for the Stata lab on May 22nd.
- Clinical Research Stata Exercise May22 2007.doc This handout contains the worked problems for the lab exercise on May 22, 2007.
Regression for Non-Normally Distributed Data using SAS (Generalized Linear Models)
The Regression for Non-Normally Distributed Data Using SAS Workshop is presented by CSCAR.
Download the SAS commands and the necessary data sets listed below, to the c:\temp\glmwkshp folder. You will need to create this folder before you begin.
- Lab Examples 1-5 Tecumseh Study commands: tecumseh_genmod.sas SAS commands for Tecumseh Study.
- Lab Examples 1-5 Tecumseh Data: tecumseh.sas7bdat SAS data set for Tecumseh Study.
- Lab Examples 1-5 Tecumseh Data in Excel: tecumseh.xls Excel File for Tecumseh Study.
- Lab Example 6 Alligator Data commands: alligator.sas SAS commands for a log-linear model, with a categorical outcome (food preference of alligators), being predicted by alligator size, and the lake in which the alligators were located.
- Lab Example 7 Ship Data commands: ship.sas SAS commands for the Ship Data (Poisson Regression with an offset).
- Lab Example 7 Ship Data Set (Excel File): ship.xlsExcel data set to use for ship example.
- Lab Example 8: Epilepsy Data SAS commands (data are included in the command file) epilepsy.sas Data and SAS commands for the Epilepsy study.
- Lab Example 9: Tecumseh Study SAS commands to set up longitudinal data for GEE analysis. tecumseh_gee.sas SAS commands to set up the Tecumseh data in longitudinal form for GEE analysis.
- Glimmix macro. glimmix.sas SAS commands to define the glimmix macro. Download this command file to your c:\temp\glmwkshp\ folder.
Epidemiology 556:
- data.xls Click here to download the practice class data set.
- epid556.sas Click here to download SAS commands from Class 1 of Epid 556. These commands show how to get basic descriptive statistics for a data set imported from Excel.
- epid556class2.sas Click here to download SAS commands from Class 2 of Epid 556. These commands show how to import an Excel spreadsheet using SAS commands, how to get simple descriptive statistics, bar charts, scatter plots, correlations, and regressions. The calculation of new variables
- Class2analysis.docClick here to download the SAS commands from Class 2 of Epid 556, plus the output in a Microsoft Word Document.
Epidemiology 552:
- Epid552_Fall2003.doc Instructions for getting data from American Factfinder and Running Commands in SAS.
- age_sex.xls Excel file containing Age and Sex Distribution for United Stages, Michigan and a sample County.
- setup_age_sex.sas SAS command file to read in the AGE_SEX.xls file and do cross tabs.
- hospital.sas SAS command file to read the hospital discharge data set.
How to Import an Excel Worksheet in SAS Release 8 for Windows.
Instructions for importing an Excel 4.0 worksheet called Pulse.xls and saving it as a temporary SAS data set are included in slides shown below. Click on any slide to get an enlarged version.
Slide2.GIF
Slide3.GIF
Slide4.GIF
Slide5.GIF
Slide6.GIF
- Go to File...Import.
- Choose the File Type as Excel 4.0 Worksheet.
- Locate and select the file using the browse button.
- Save the data set and finish.
- Check the log to be sure the data set was created.
Pictures of Maya!
Click here to see pictures of our granddaughter, born April 21, 2010.
Pictures of our Japan Trip, November, 2007.
Click here to see our Japan Pictures.
Pictures of fishing at the Outer Banks, North Carolina.
- Fishing in Currituck Sound.
- Landing a nice striped bass.
- A nice striped bass.
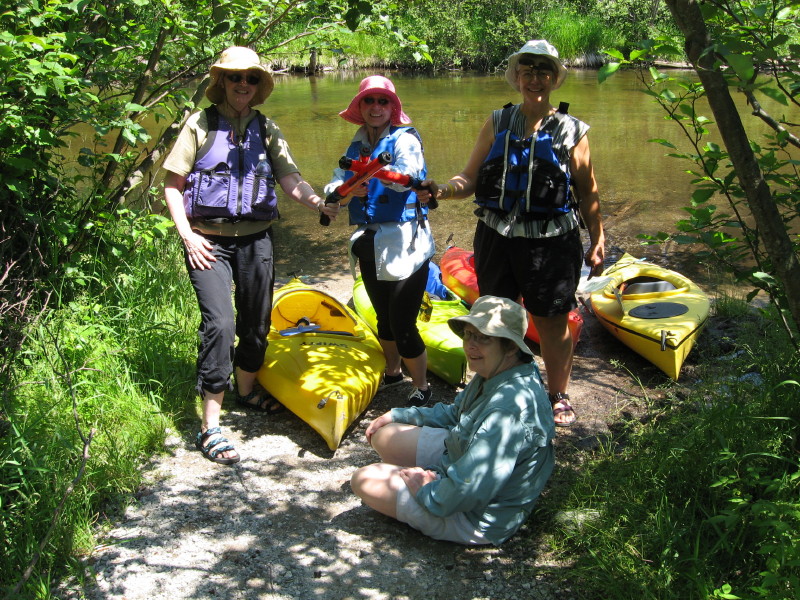
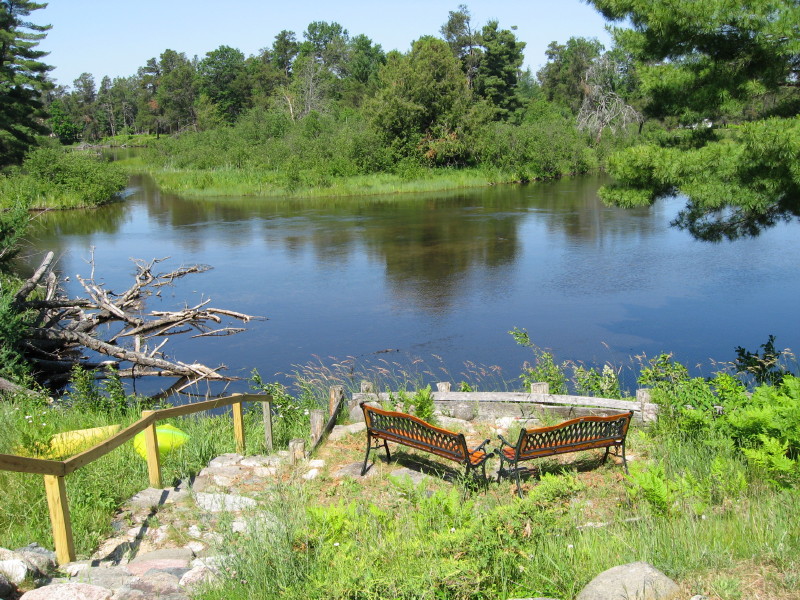
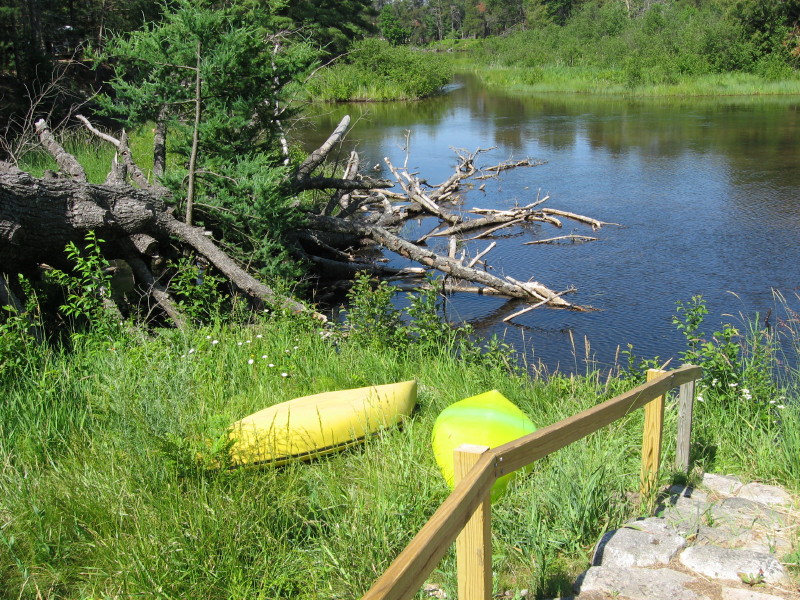
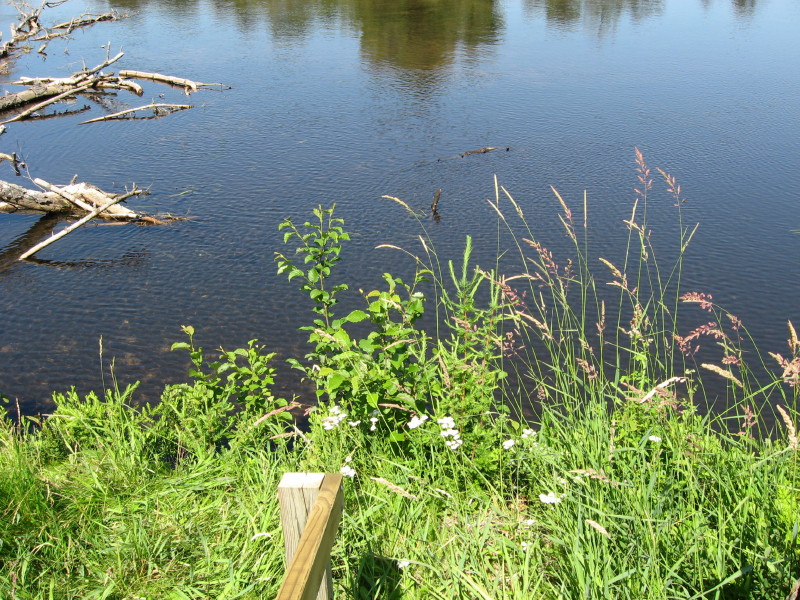
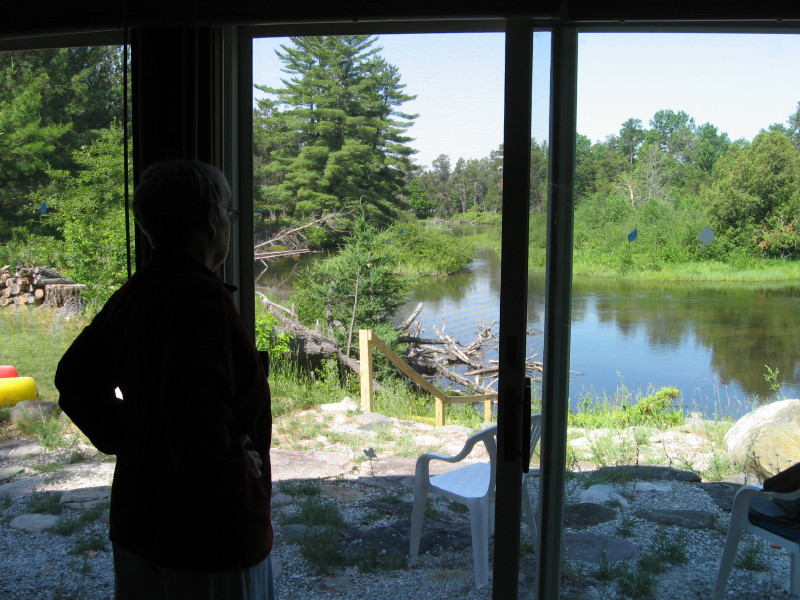
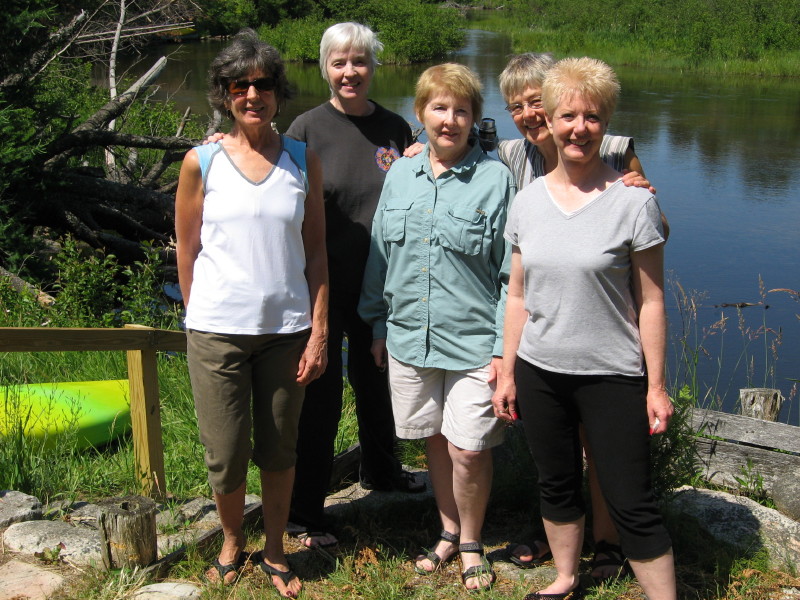
Pictures of our Manistee River Kayaking Trip are available here.
- Starting out beside the Manistee River North of Grayling.
- A view of the Manistee River from our cabin.
- Kayaks parked for the night at our cabin.
- Little flowers by the river behind our cabin.
- Not a bad back door view!
- The kayaking gang of five.
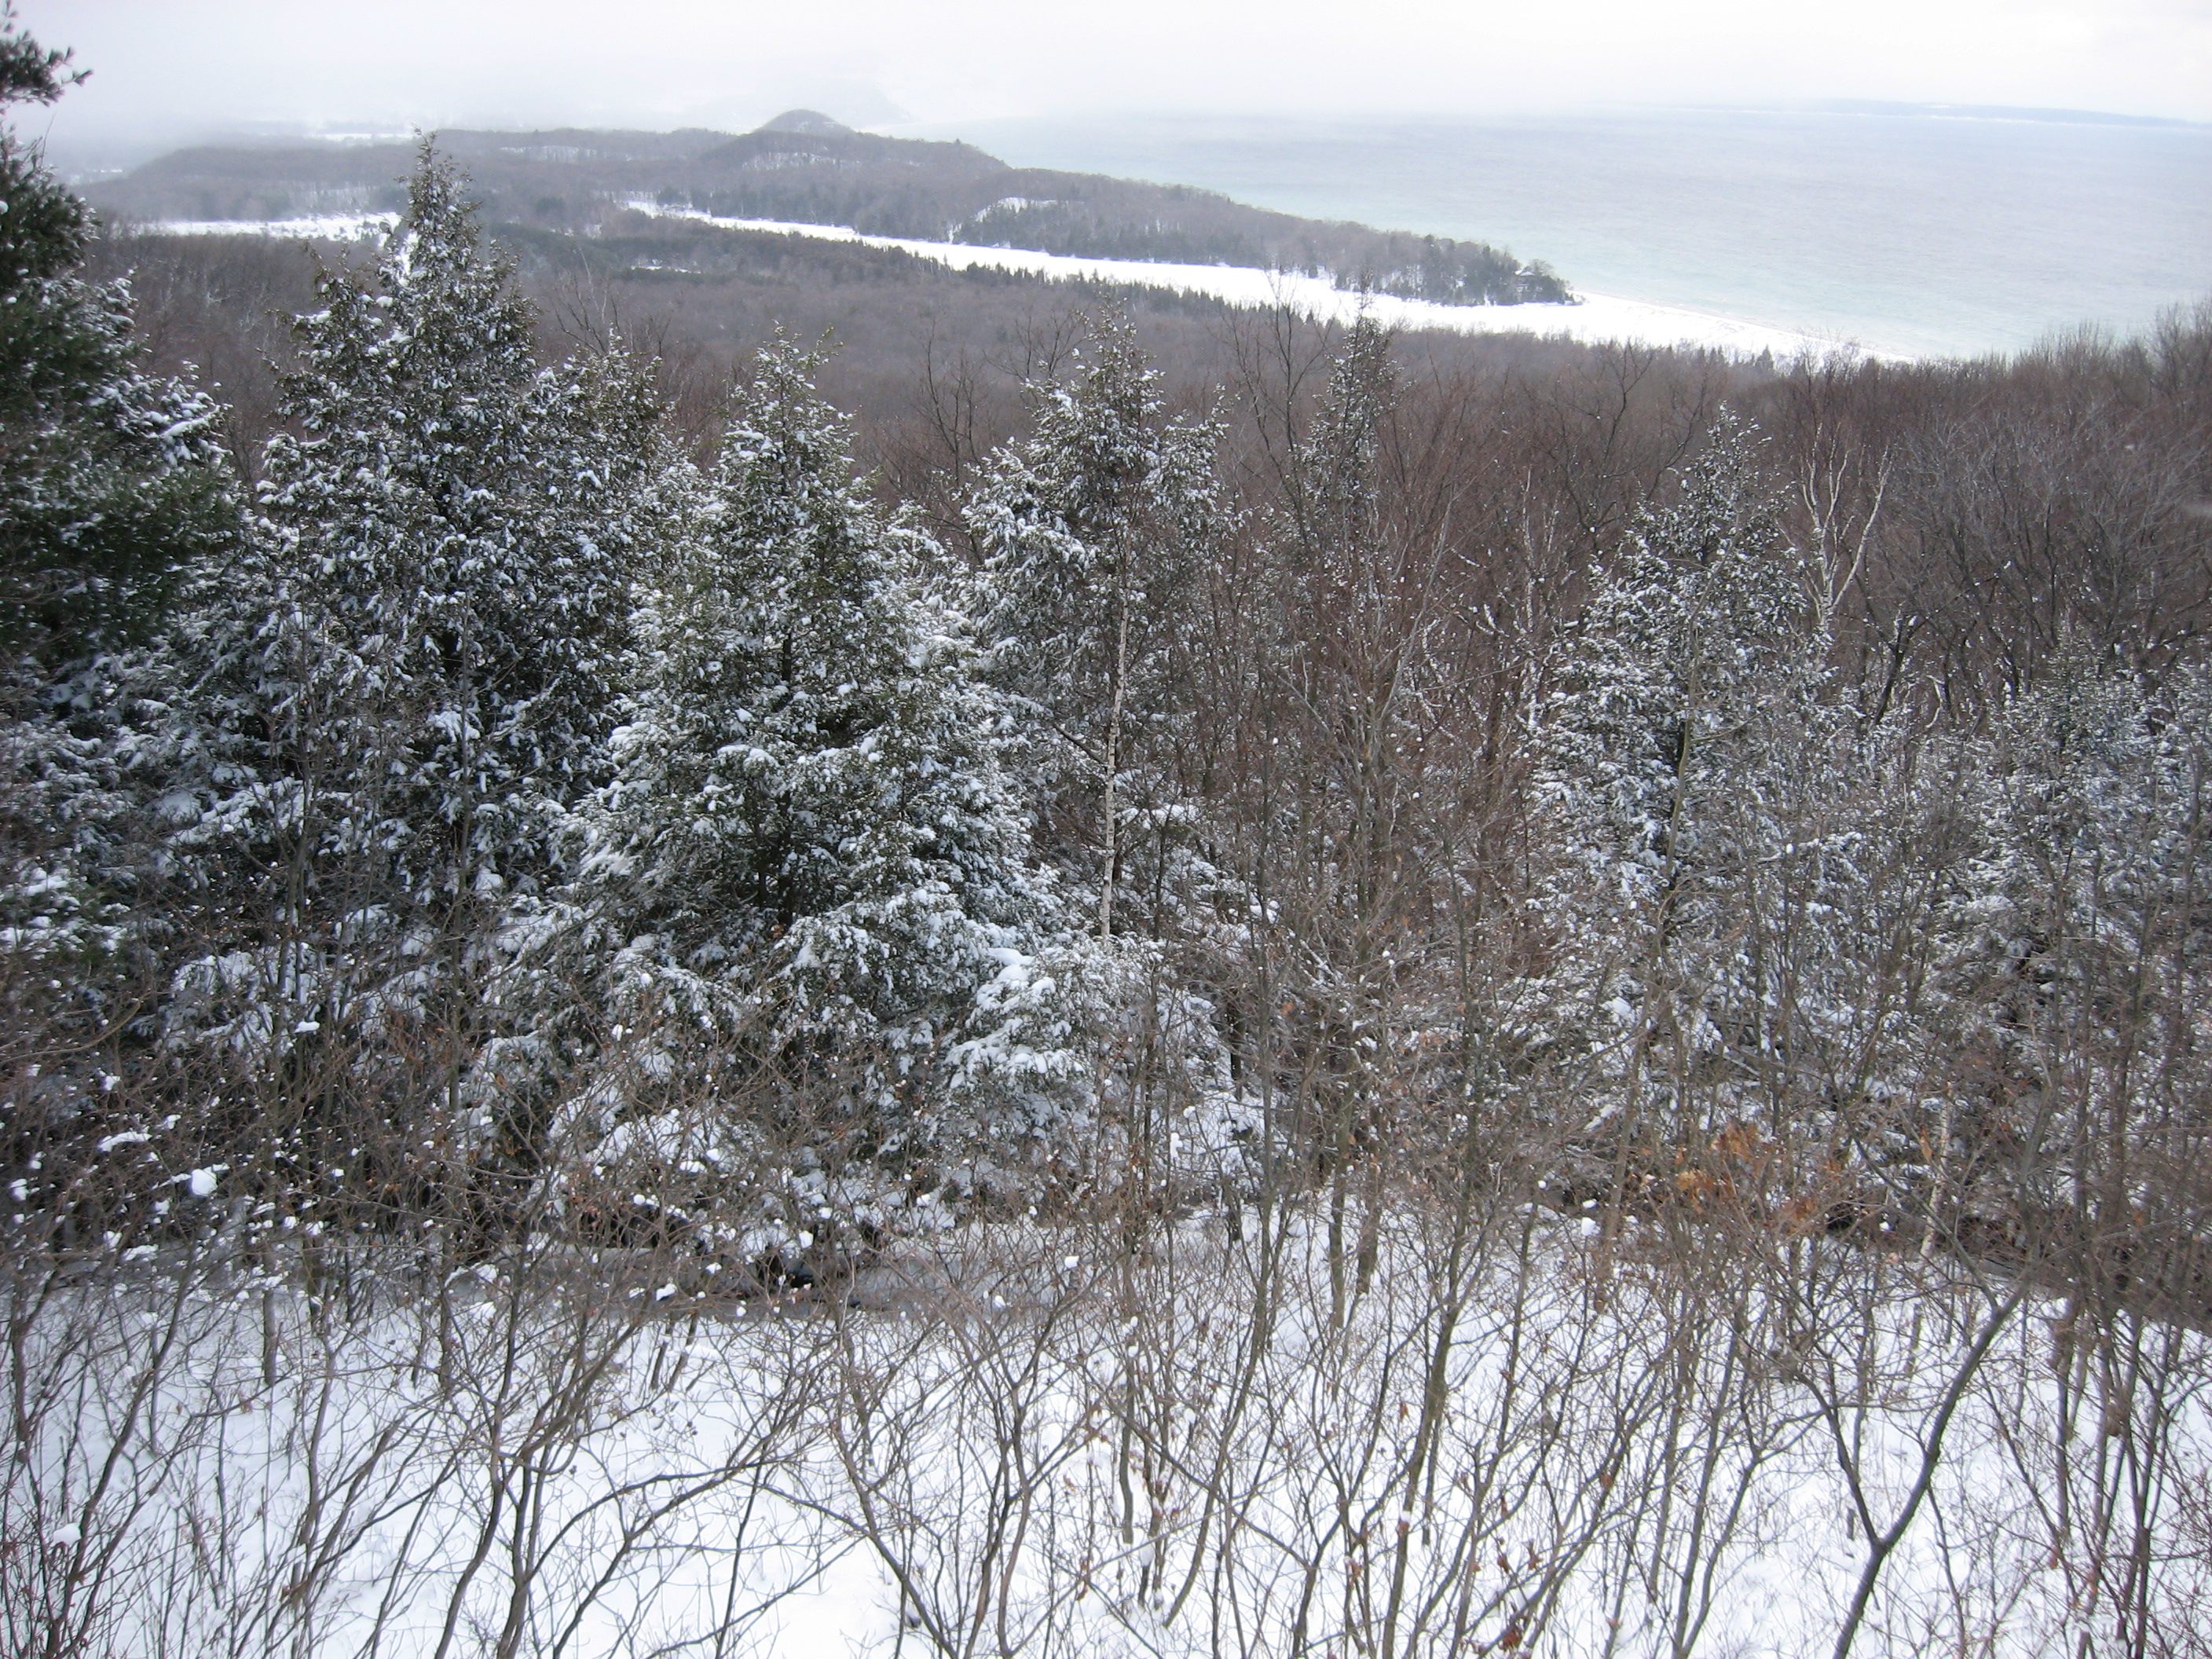
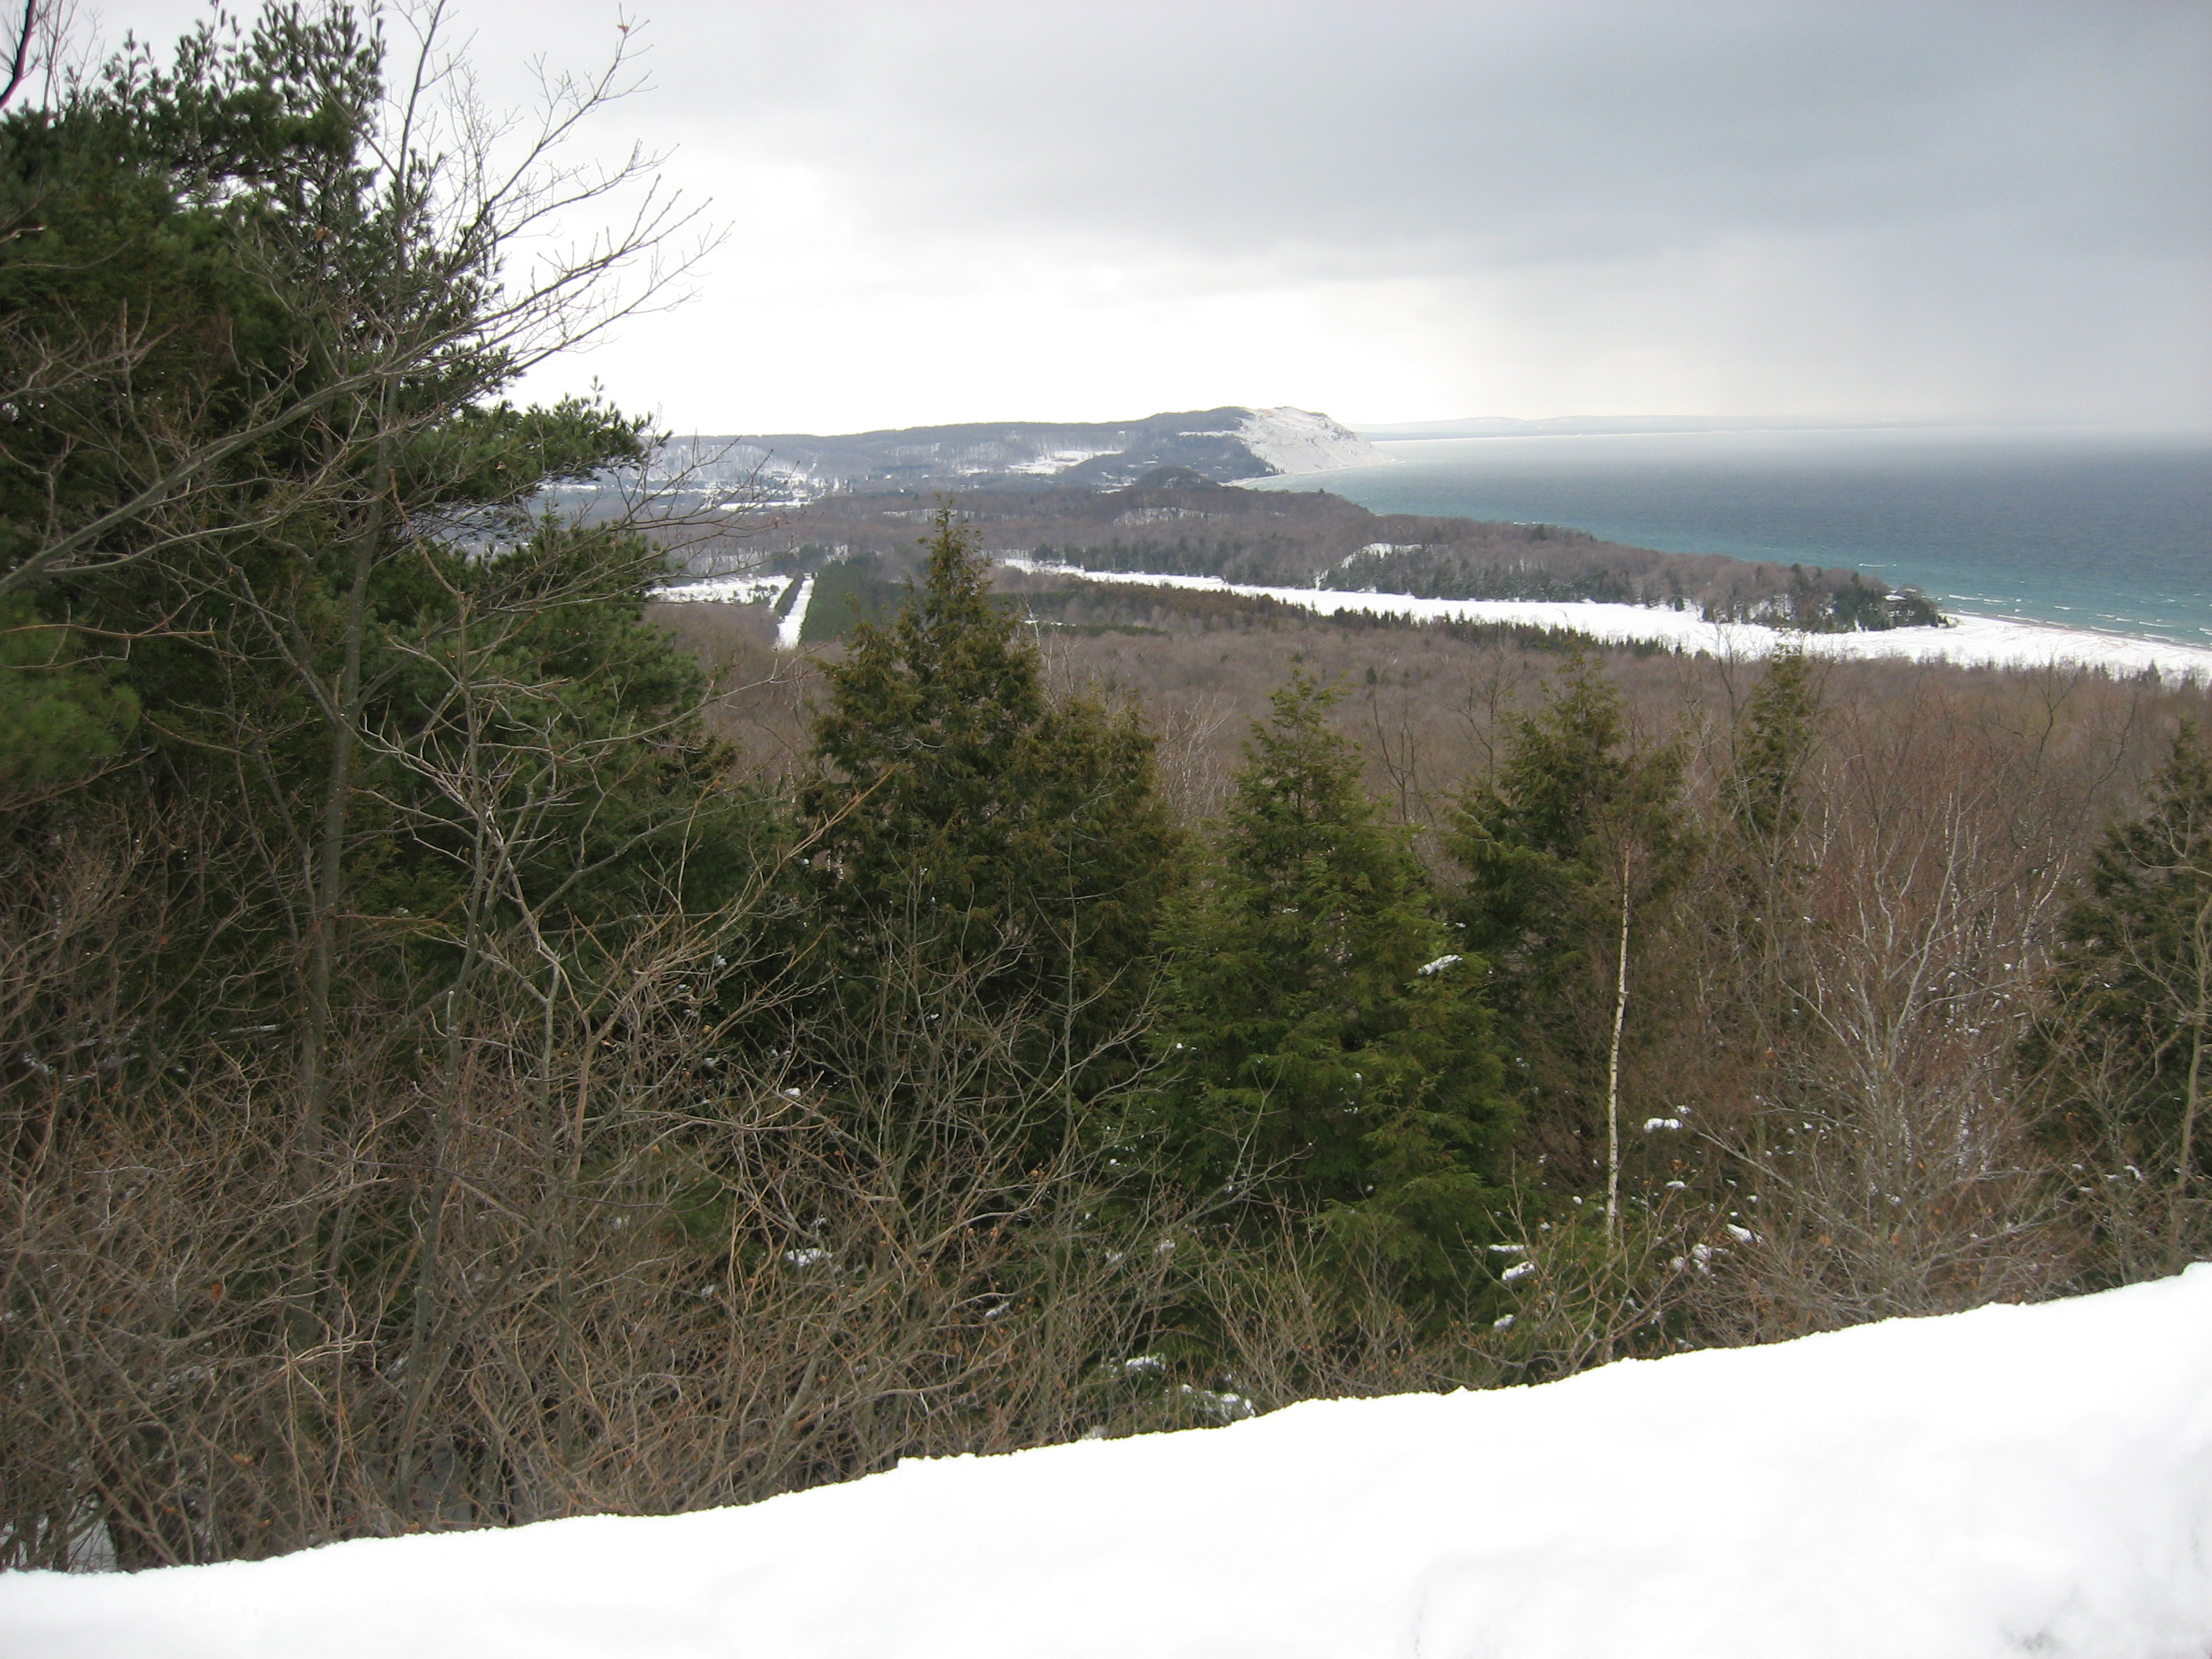
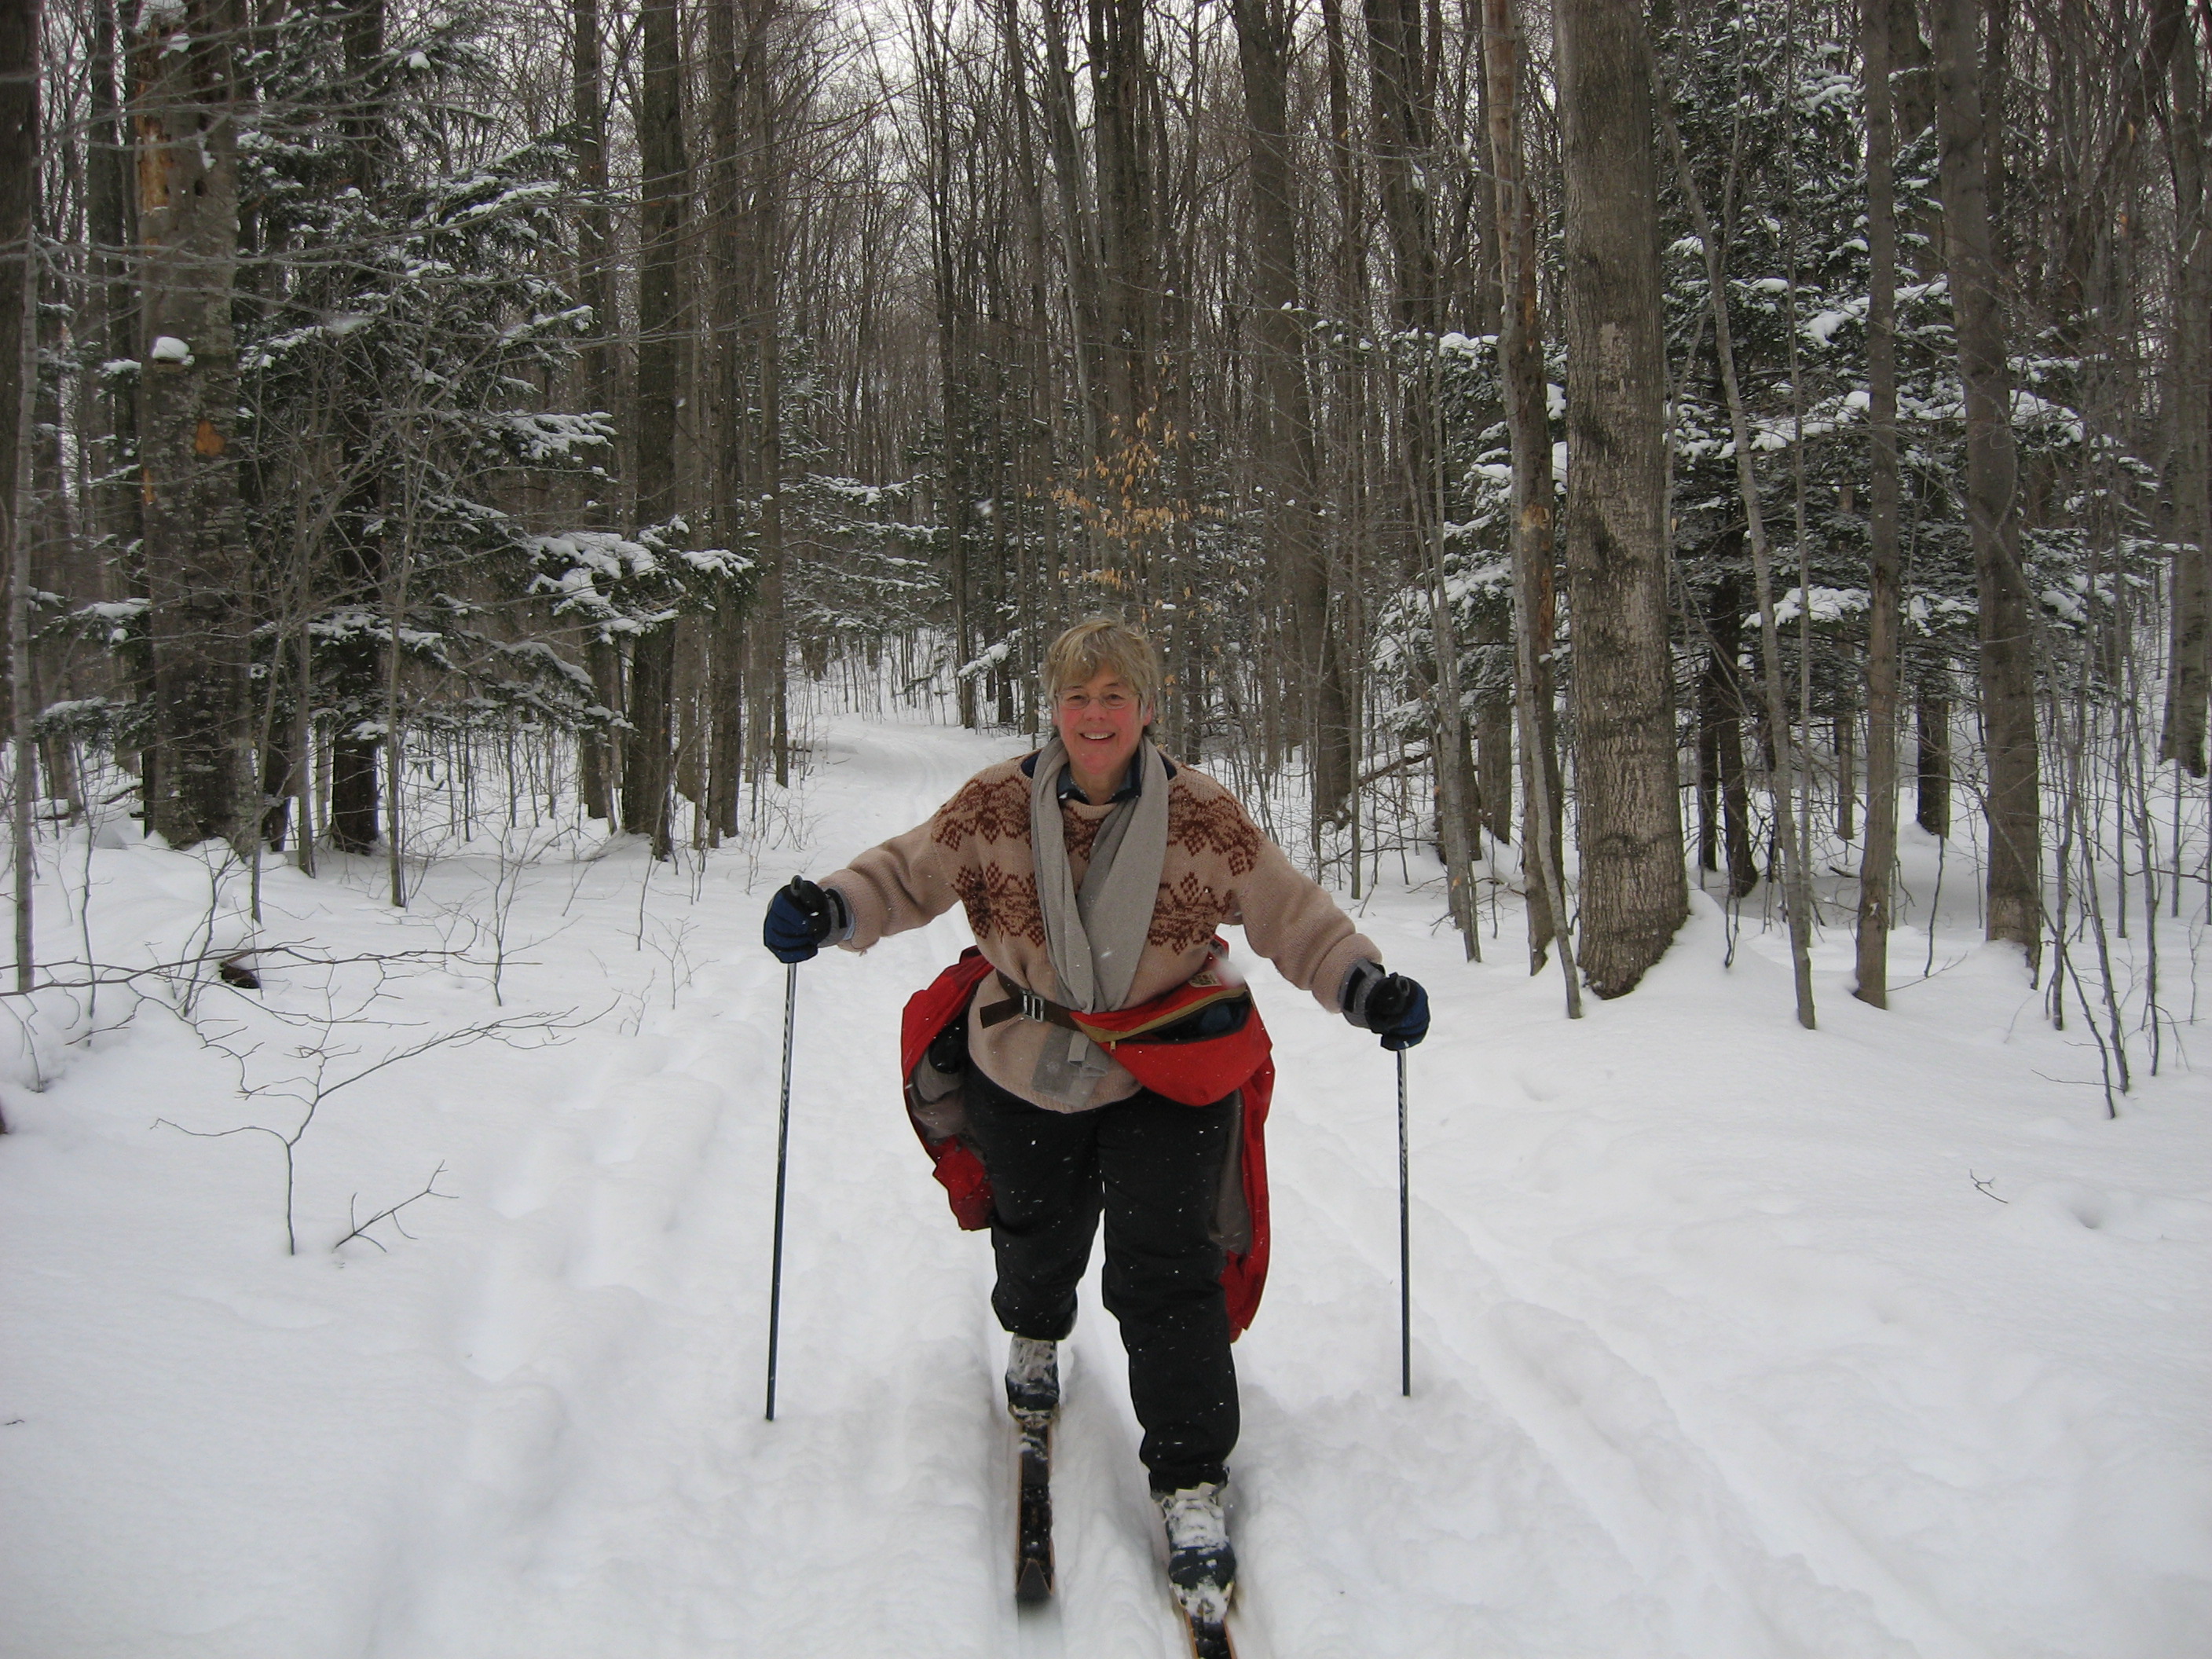
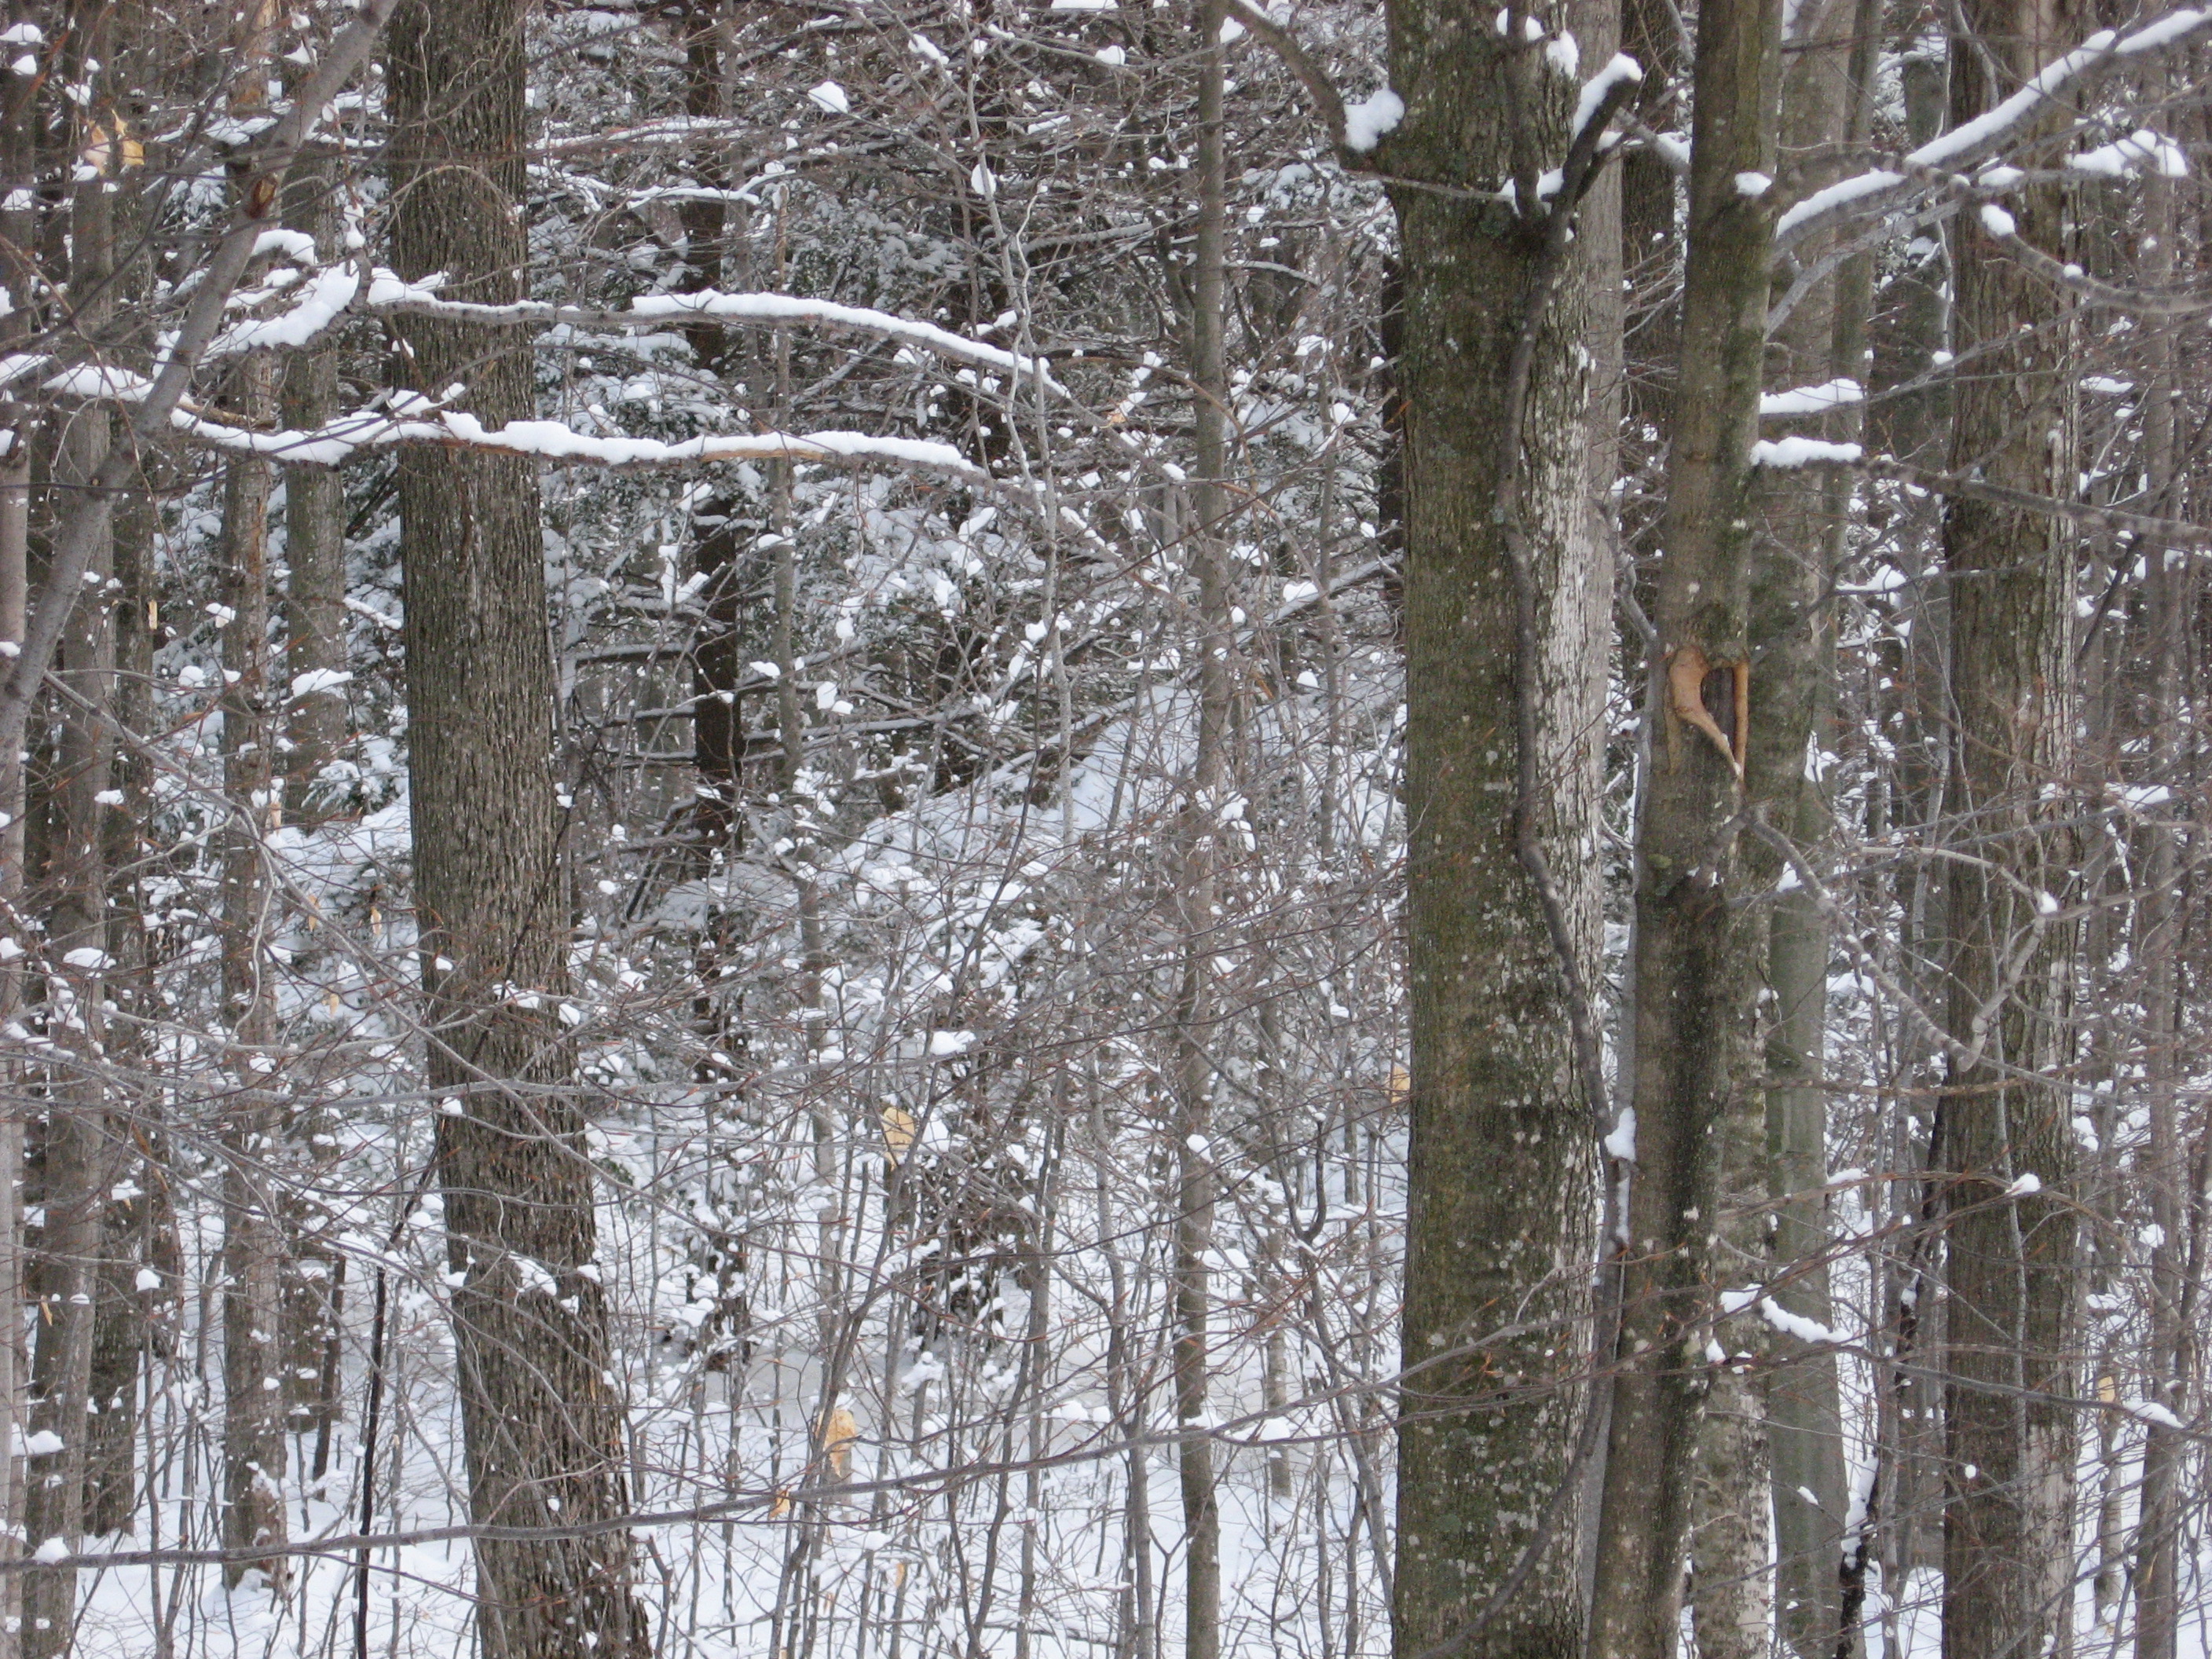
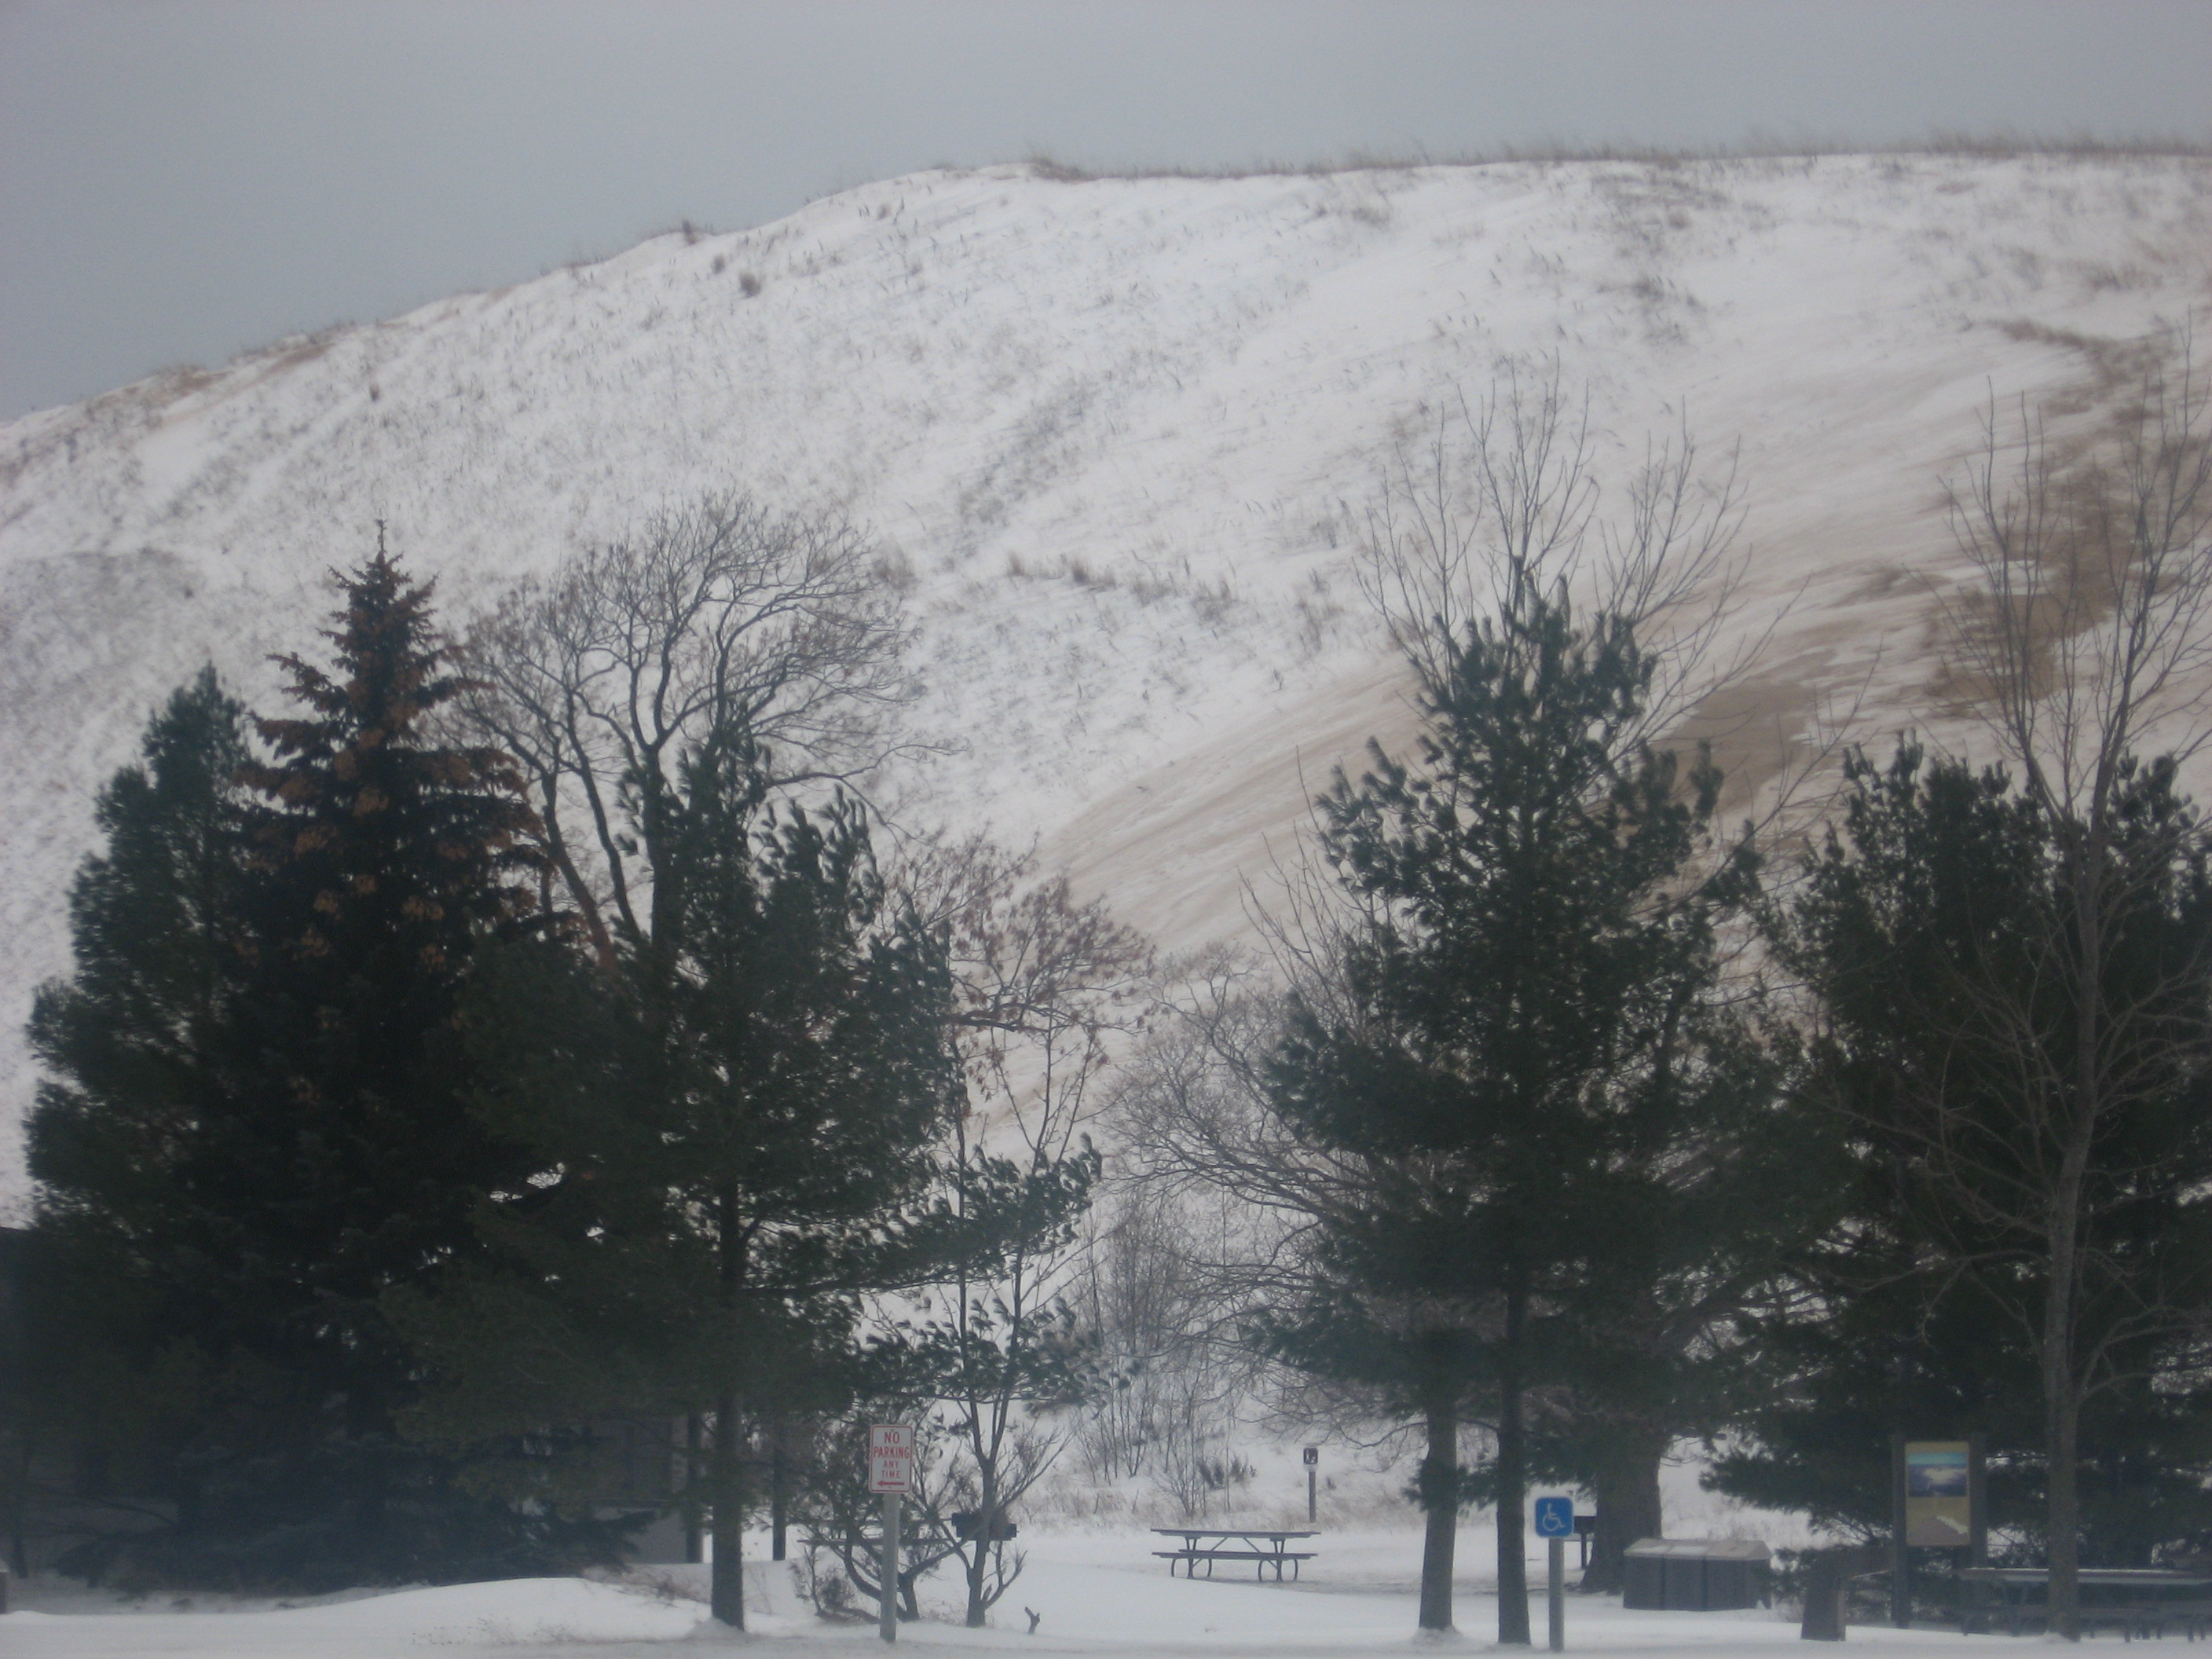
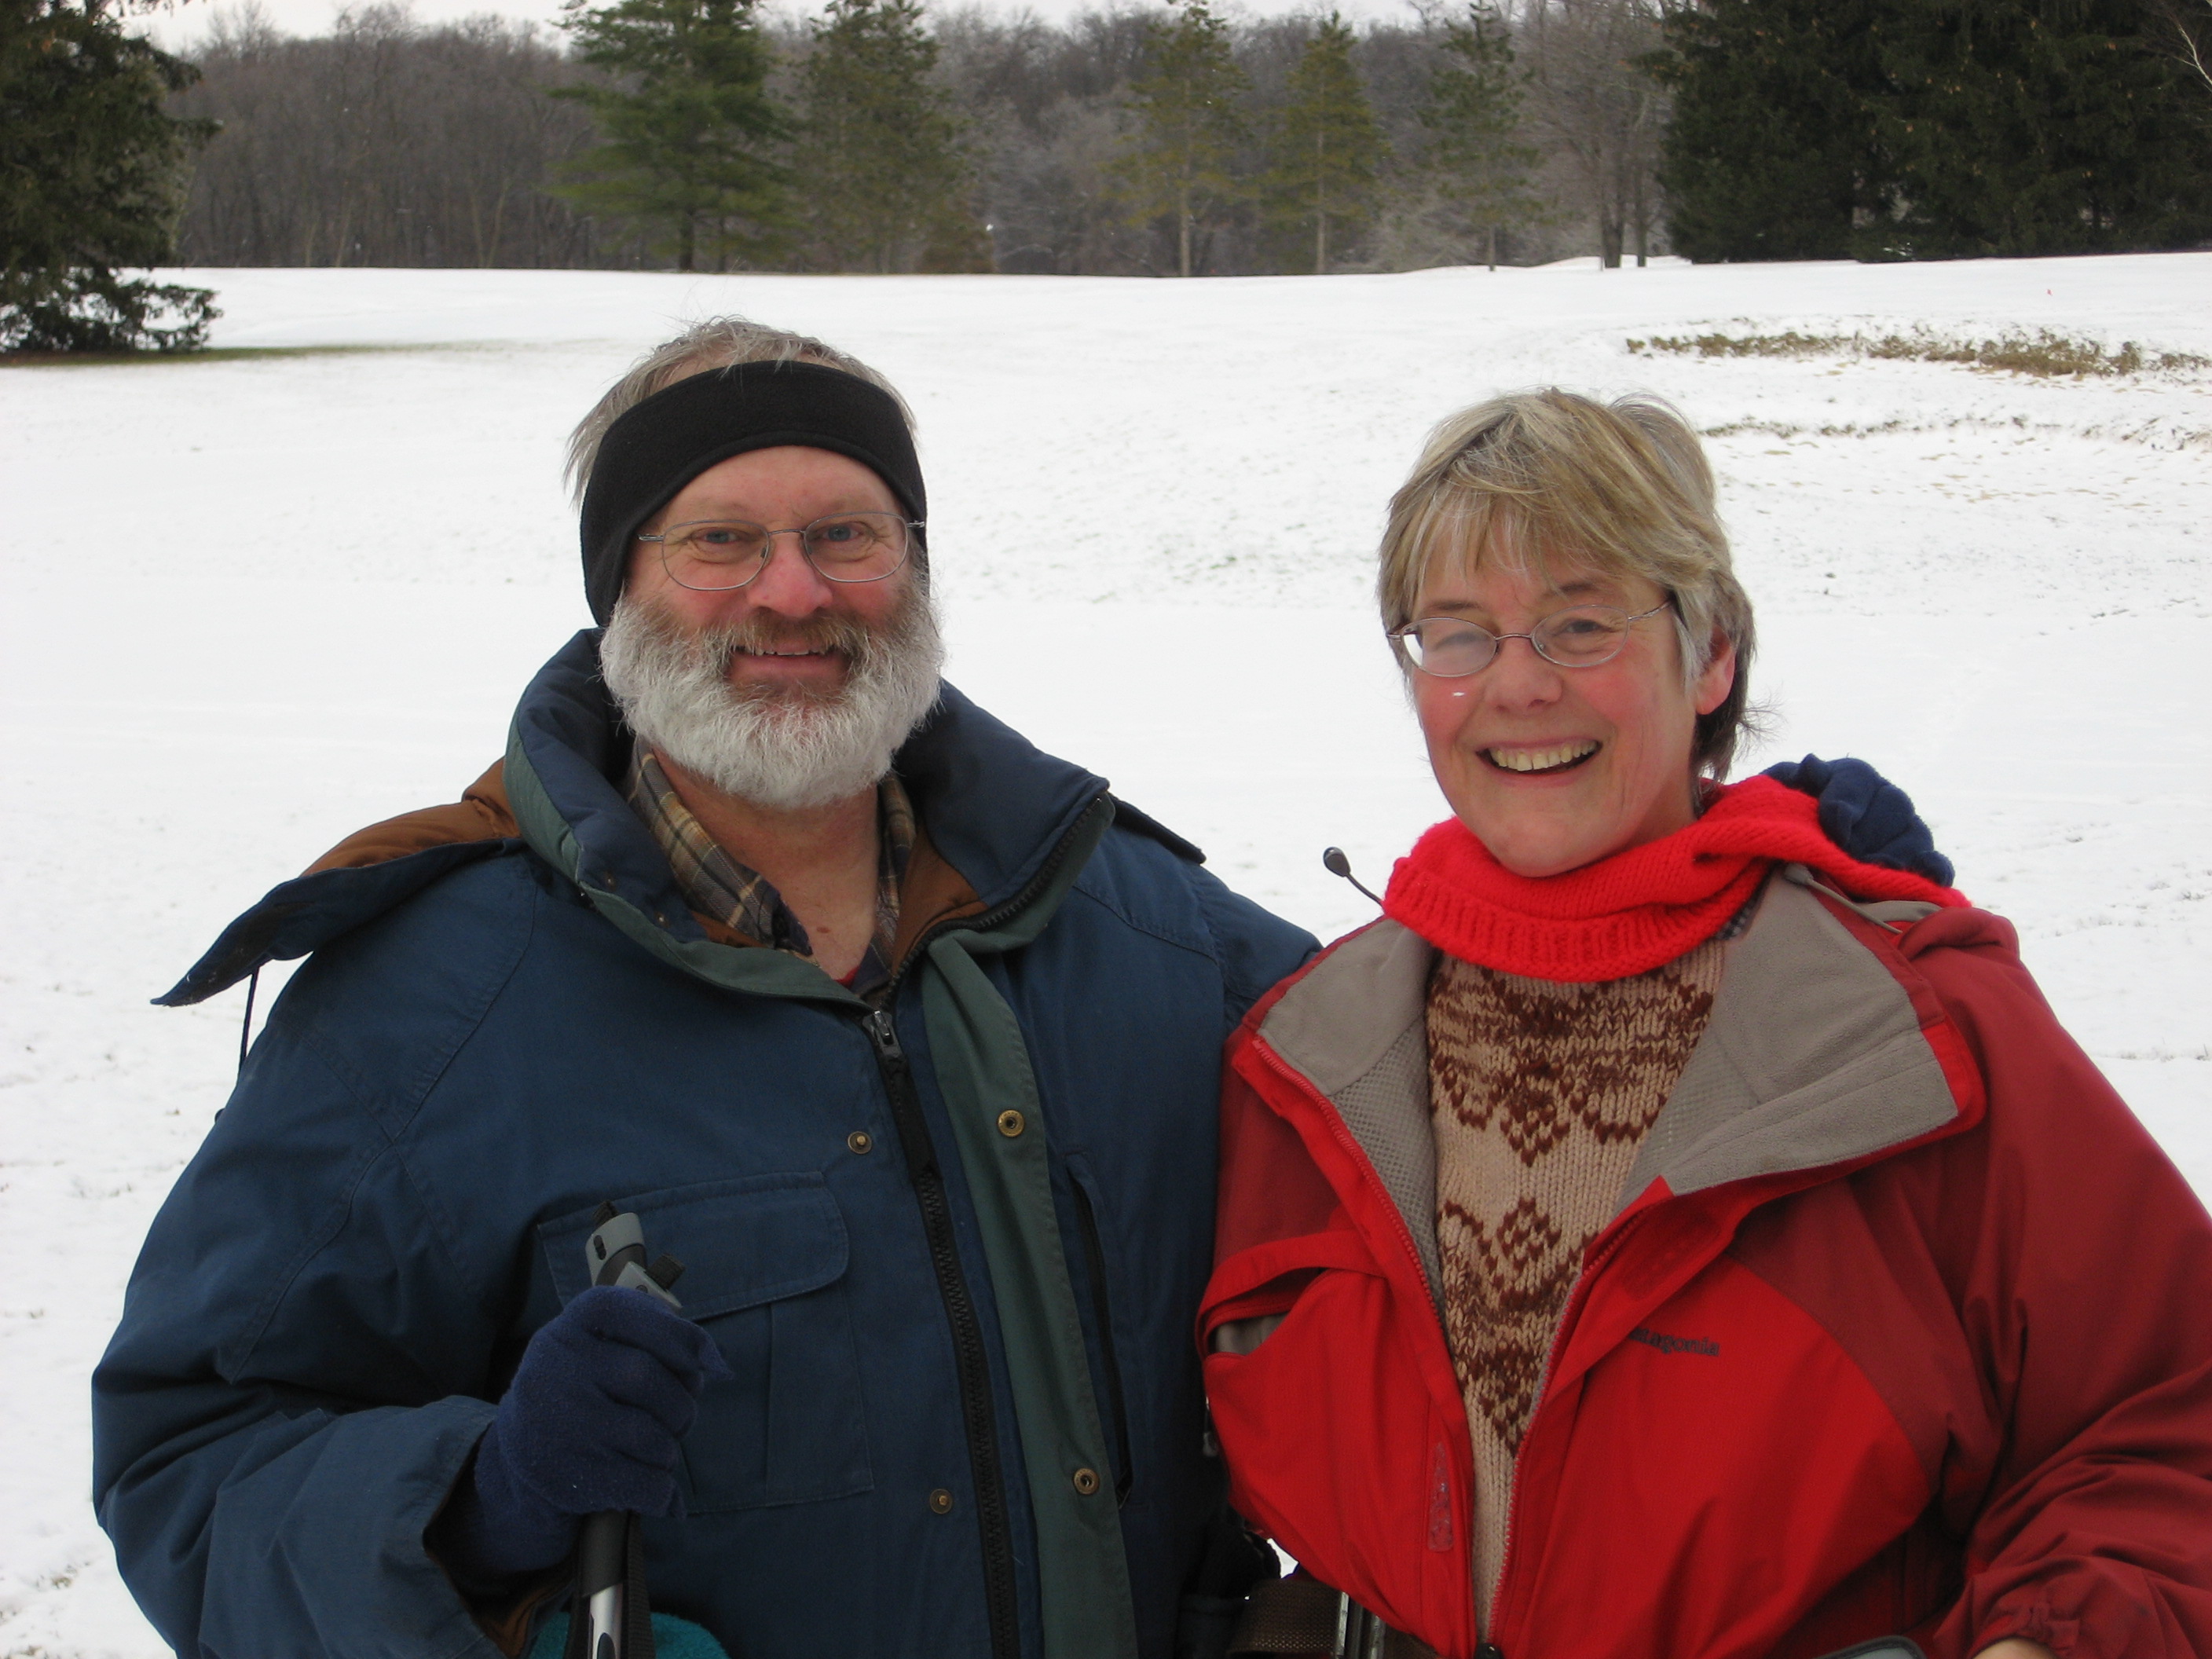
Pictures of our winter 2007 cross-country skiing weekend at Sleeping Bear in northern Michigan.
- View of Lake Michigan from the Pierce Stocking Road on a snowy data at Sleeping Bear.
- Another view of Sleeping Bear Dunes and Lake Michigan from the Pierce Stocking Road. Not as snowy on this day!
- Skiing on a trail at Sleeping Bear.
There were signs warning us about cougars, but I'm sure I could have outskiied them!- Snowy pine trees at Sleeping Bear.
- Snowy hardwoods at Sleeping Bear.
- Yes, this is the Sleeping Bear dune, and it was cold! Kids were actually sledding down this dune.
- OK, so this is actually Jim and me skiing at Radrick Farms outside Ann Arbor.
Jim and I went to Tamil Nadu in the South of India in the spring of 1999. Click on the map of India to go to our India Page!
last updated: January 10, 2009 - CSCAR