KubarychGroup

Two-dimensional infrared (2DIR) spectroscopy can follow reactions at equilibrium. By vibrationally “tagging” reactant molecules and reading them out after they have randomly become product molecules, new cross peaks in the 2D spectrum appear. The time dependence of these cross peak growths tell us how fast the populations are interchanging. For two states, the exchange rate constant kobs is equal to the sum of the forward and reverse rate constants. Temperature dependent experiments permit extraction of the barrier to exchange using Arrhenius or Eyring analyses.
Most recently, we have used the ability to watch equilibrium chemical reactions to test the dependence of activated barrier crossings on the viscosity of the solvent. Although we intuitively expect increased viscosity to slow the reaction, precise tests of the long-established Kramers theory have proven challenging due to the linear dependence on solvent friction, but exponential dependence on energy. Our most recent work shows that dicobalt octacarbonyl is an ideal system to test Kramers theory in linear alkanes since there is essentially no energetic changes among the solvents, thus allowing the direct isolation of the dynamic solvent friction.
Ultrafast Chemical Exchange
At equilibrium molecules still react! Lacking macroscopic changes in populations of reactants and products, the most common way to measure kinetics is to perturb the system and watch its return to equilibrium. Without any chemical perturbations, 2DIR chemical exchange allows us to watch equilibrium kinetics directly with sub-picosecond resolution.
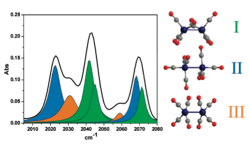
The example here is Co2(CO)8 in n-hexane solution. The FTIR spectrum can be assigned to three isomers. 2DIR cross peaks grow (see left) indicating exchange among the isomers.
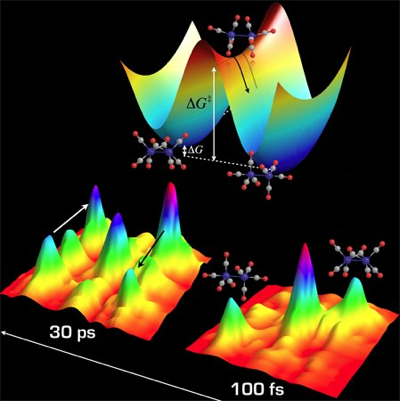
The animation above illustrates why we can see changes in cross peaks due to chemical exchange. The simulation uses a Monte Carlo approach to treat a chemical equilibrium between two species denoted with blue and yellow pixels. At all times the system maintains an equilibrium ratio of species (lower left pane). In the upper right pane, the decaying curves show the fraction of molecules that are in their initial state at each time step. The growing curves show the fraction of molecules that are in the other state at each time step (i.e. they have exchanged). The bottom right pane is just a zoom on the exchange curve.
If the system remains at equilibrium, how can we observe anything? The image in the upper left explains this: the aspect of the experiment that is non-equilibrium is the knowledge of which molecule is in which state. That knowledge is out of equilibrium, and its decay tells us how fast the equilibrium is reached.