Overview
In recent years, personal fitness trackers have become increasingly popular. Fitness wristbands, such as the Fitbit Flex, have become particularly popular due to their convenient form factor and ease of use. One core function of these fitness bands is daily activity tracking using step counting, usually using an accelerometer located in the band. Due to factors such as arm swing, an accelerometer located on the wrist presents a significantly noisier picture of the forces felt by the body when walking when compared to a more traditional location for a pedometer. Because of this, step counting using an accelerometer located on the wrist presents a unique challenge for step counting.
In this project, we examine several DSP techniques to extract a step count from accelerometer data. We then add an FFT-based filter to help our algorithm perform well on noisy, wrist-based accelerometer data. We then present several tunable constants that allow our algorithm to trade-off false positives and false negatives, as well as trade performance for accuracy. Finally, we compare our accuracy to that of a commercially available device, the Fitbit Flex.
Data Collection
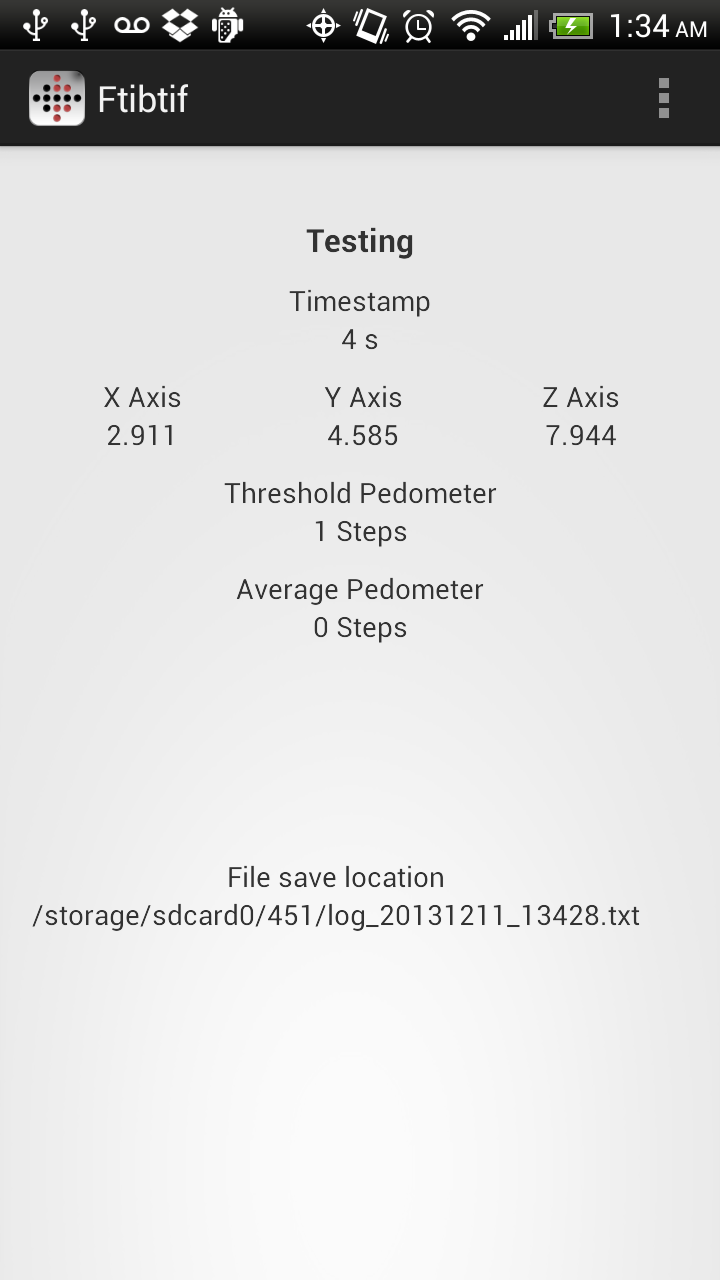
When we started gathering data using our given sensor application, we encountered several issues that led us to develop our own android application to gather and analyze data.
The most important issue was the timestamps for gathered data was occasionally the same. This was because the application outputted data with a millisecond time scale. We created our own android application to log accelerometer data and output events time steps with a microsecond timescale. This allowed us to distinguish between closer occurring events.
Another problem that we encountered was that we did not know what the accelerometer data was sampled at. The values between each event varied from 1ms to 20ms in the original application. With our own application, we managed to achieve a sample rate of about 100 Hz.
Once we gathered this data on the Android application, we wanted to do real time processing for step counts. For each event recorded, the magnitude of acceleration was calculated. This was then compared to two different threshold values. This magnitude would have to go below the lower threshold and above the higher threshold for a step to be counted.
The second pedometer algorithm on the Android phone used two moving averages. It used the average magnitude for the last two thousand samples as a baseline. The average for the last one hundred samples was then used as a comparison to the baseline.
These two pedometer algorithms were not very accurate on the phone. For more accurate detection, we would have to filter our collected data.
The Fitbit step count was acquired by first syncing the Fitbit Flex with the Fitbit Connect software to obtain the current step count on the device. Second, a waiting period was taken where our team member wearing the Flex did not move. Following this, the Flex was synced again to ensure no steps had been added. The trial was then started, and upon completion, the Flex was immediately synced to obtain the final step count.
Methods
Method 1
The first method we tried was power thresholding using a simple causal moving average. In addition, to reduce noise, we apply a windowed filter to the input.
Since the phone accelerometer is not sampled at a constant rate, the first step was to normalize the sampling rate to 100Hz by doing a linear interpolation.
--- Code ---
time = accData(1, :);xvalue = accData(2, :);
yvalue = accData(3, :);
zvalue = accData(4, :);
r_time = time(1):10000:time(end);
r_xvalue = interp1(time, xvalue, r_time);
r_yvalue = interp1(time, yvalue, r_time);
r_zvalue = interp1(time, zvalue, r_time);
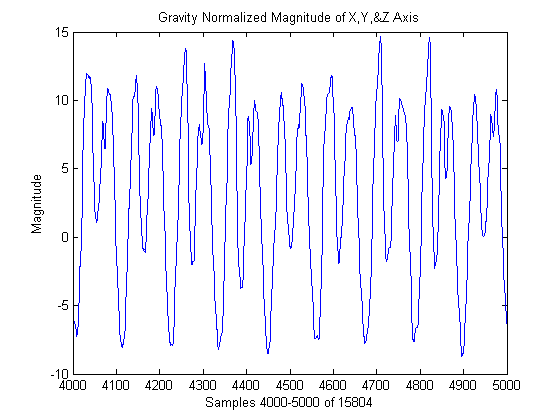
mag = sqrt( r_xvalue.^2 + r_yvalue.^2 + r_zvalue.^2 );
normalized_mag = mag - mean(mag);
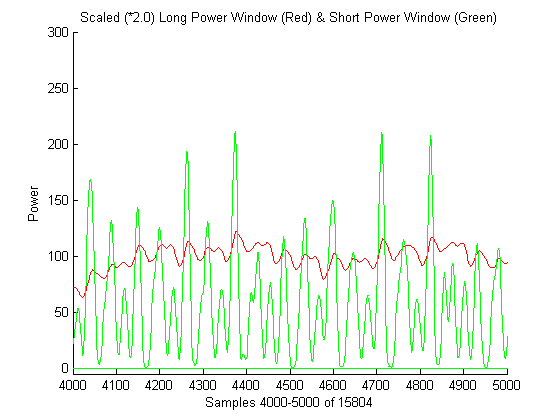
Next, we break up the signal into overlapping windows of size 200 (representing about 2 seconds of accelerometer data) and windows of size 10 (representing about 0.1 seconds). This gives us a "long term" signal, representing the steady state of the accelerometer, and a "short term" signal, representing the instant state of the accelerometer.
Then, we compute a windowed FFTs for each signal, bandpass filter out all frequencies that result in noise, and compute the average power for the filtered signal.
--- Code ---
short_m = 10;short_power = zeros(n);
for t = short_m+1:length(normalized_mag)
short_freq = fftshift(fft(normalized_mag(t-short_m:t)))/sqrt(short_m);
short_freq = filter(short_freq);
short_power(t) = (sum(abs(short_freq) .^ 2))/short_m;
end
long_m = 200;
long_power = zeros(n);
for t = long_m+1:length(normalized_mag)
long_freq = fftshift(fft(normalized_mag(t-long_m:t)))/sqrt(long_m);
long_freq = filter(long_freq);
long_power(t) = (sum(abs(long_freq) .^ 2))/long_m;
end
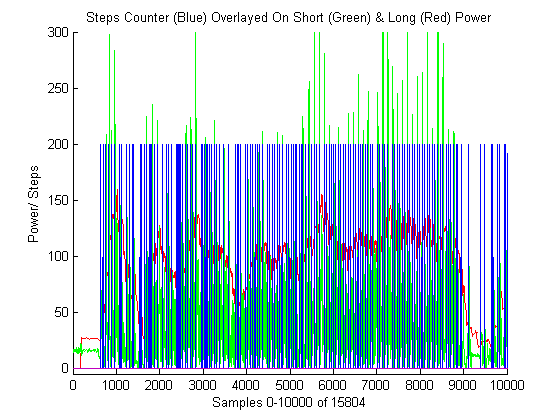
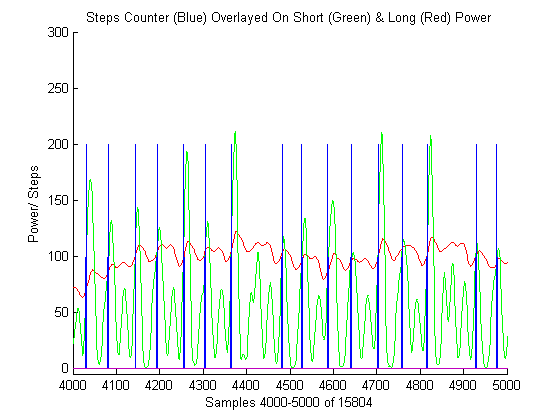
Finally, we turn our power signal into steps by creating an impulse whenever the short signal power is greater than the long signal power multiplied by a threshold value. We then locate all the rising edges in the signal, and sum the number of rising edges.
--- Code ---
threshold = 2.0;step_count = numel(
find(diff(
short_power(long_m+1:end) > long_power(long_m+1:end).*threshold) == 1
)
);
In addition, notice that we have several parameters that we can adjust for this method. The first is the window size. We chose 200 for the long window and 10 for the short window because it produced the best results while still providing enough frequencies to be filtered correctly.
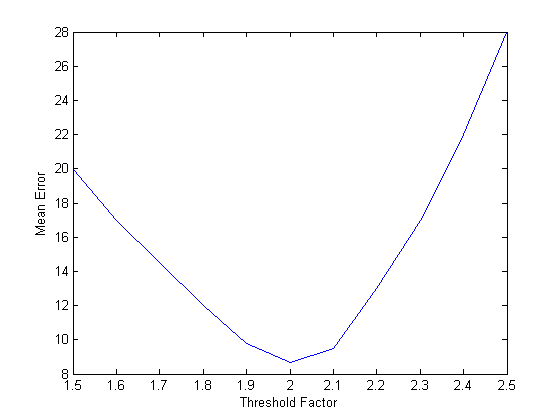
The second is the threshold factor. We experimented with several constants and decided on two because it provided the best results on a number of test cases we used. Below is our mean error squared for the three test cases provide vs. the threshold factor. As you can see a value of 2.0 gave the minimum error.
Method 2
This method is targeted toward an embedded platform because embedded systems, like a FitBit, are power, performance and memory limited.
This means that computing a real time FFT or long window moving averages is out of the question.
The step counting problem on such a constrained platform requires a novel approach.
Our group's Android app was used to collect data, which dumped text files in the same format as the class's Android app.
We wrote our own parse function, which is embedded in extend.m, to allow for more control of the formatted data.
The formatted data is then extended, which is needed because the Android API does not allow for periodic sampling.
Extension is performed by repeating the current value of the signal until the next input time stamp.
I.e. if a sin wave was input the output would be an upsampled sinusoidal stair step function.
--- Code ---
extended = zeros(3,length(n));count = 1;
for i = 1:length(accData)
while (accData(1,i) >= count)
extended(1,count) = accData(2,i);
extended(2,count) = accData(3,i);
extended(3,count) = accData(4,i);
count = count + 1;
end
end
The above mentioned method of upsampling was chosen over the classical zero filling approach because zero filing would increase the number of peaks (like an impulse train), and not making a smooth graph.
A smooth graph could also be obtained by using an interpolation function, but interpolation is expensive and deemed too computationally heavy for an embedded platform.
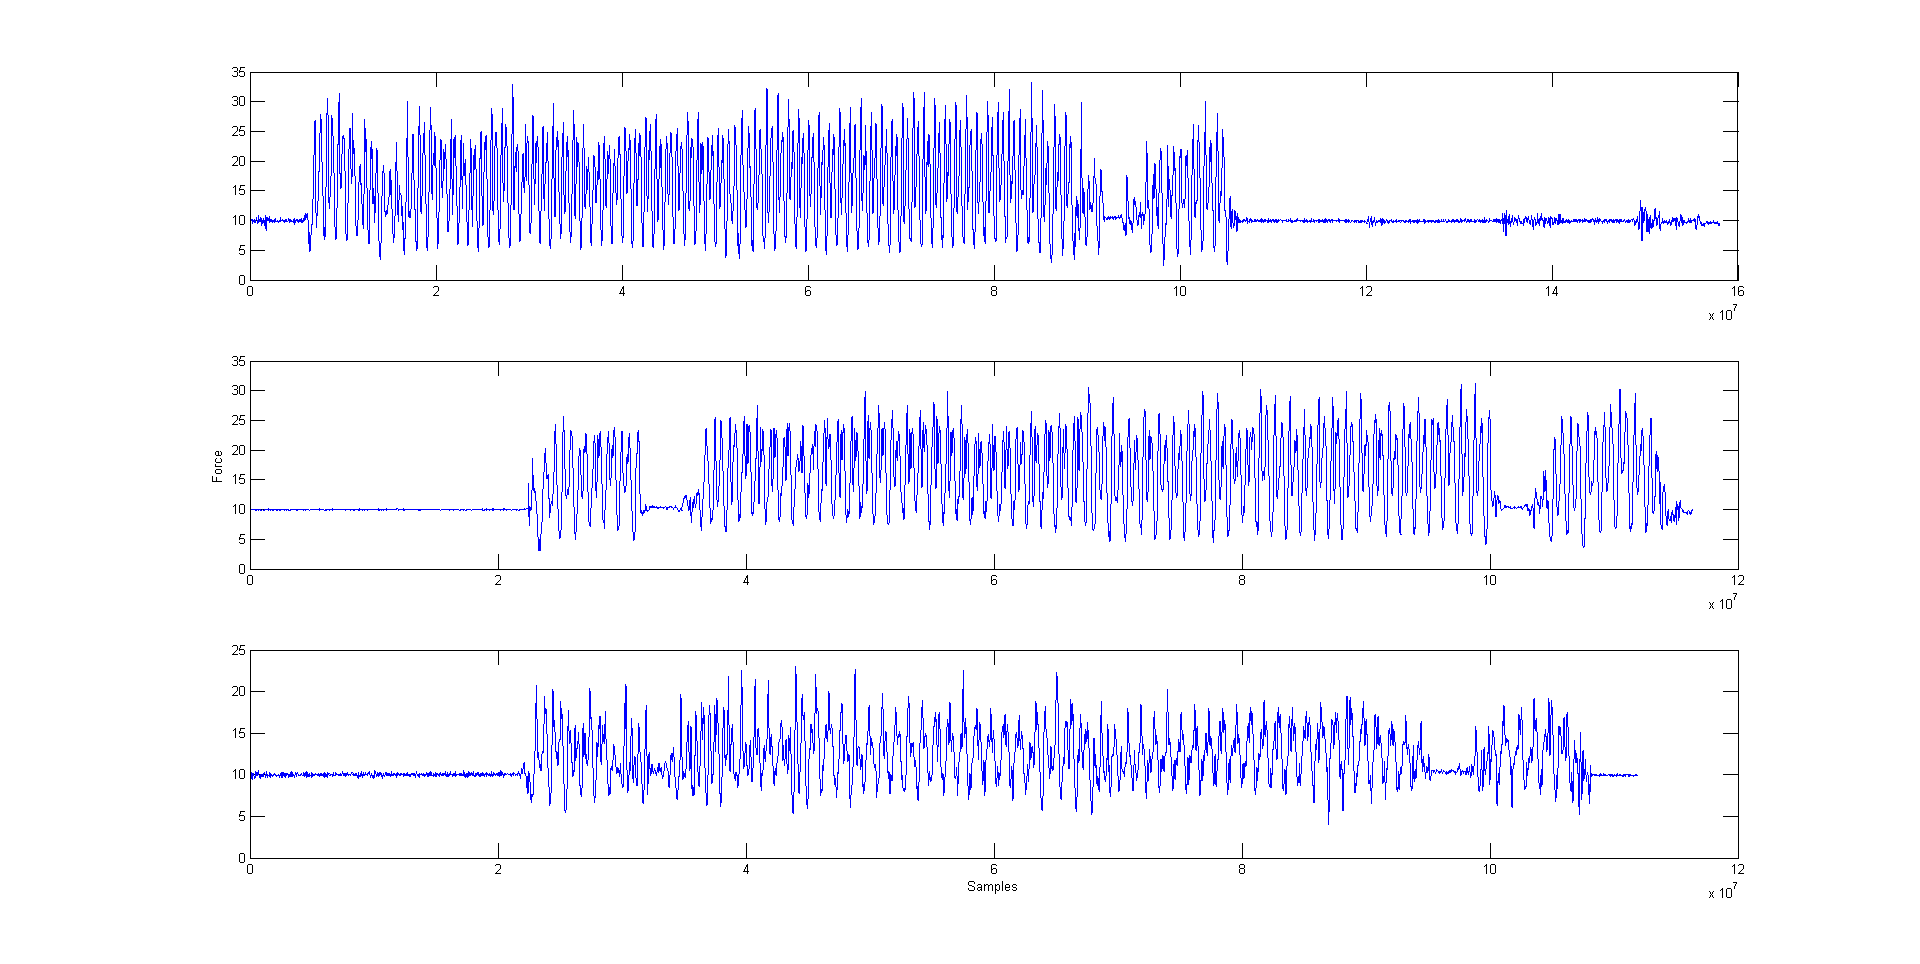
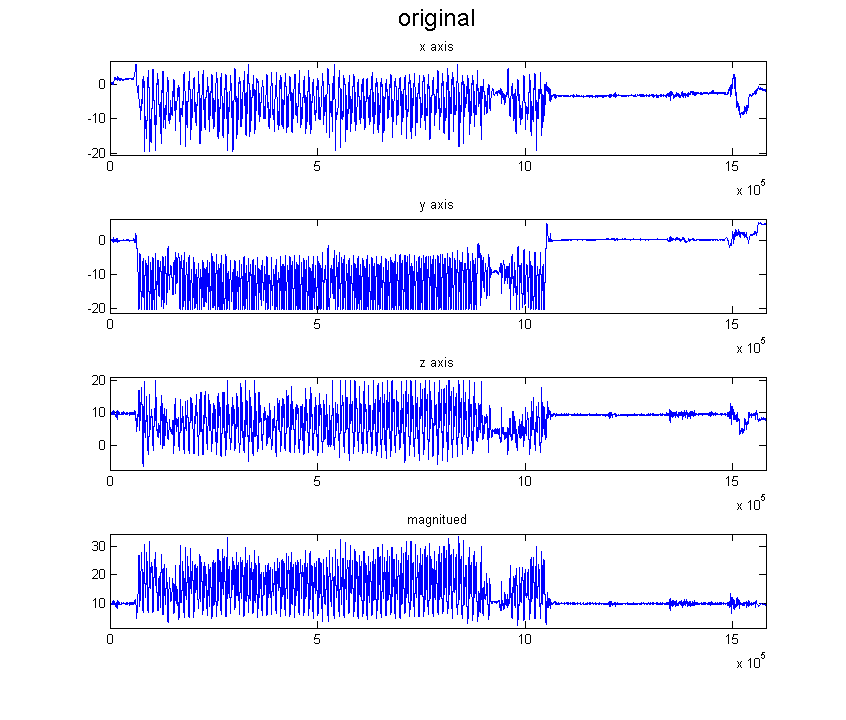
The Pythagorean magnitude is calculated from the extended data and is used as the sole source of accelerometer data.
The magnitude is used alone because the orientation of the sensor is not known nor constant during sampling.
The magnitude accounts for all of the directions and is immune to orientation.
Furthermore, the magnitude sequence is immune to bias because the bias is always equal to 9.8, gravity.
--- Code ---
x2 = extended(1,:).^2;y2 = extended(2,:).^2;
z2 = extended(3,:).^2;
mag = sqrt(x2+y2+z2);
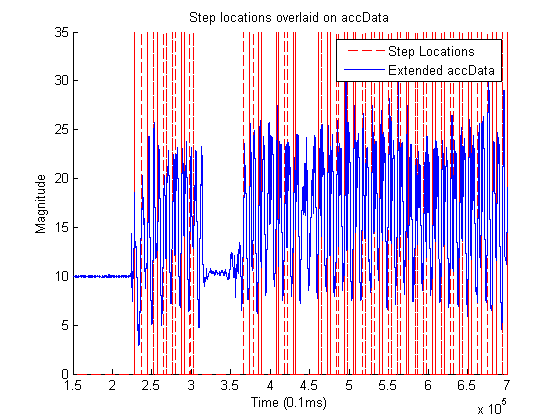
Finally, the steps can be counted.
The Step count is determined by using a threshold amplitude to do edge detection.
The time between successive rising edges and falling edges must fall within a set time window to be counted.
The combination of amplitude and time window effectively implements a frequency filter and power filter with minimal computation.
--- Code ---
function count = stepCount (vec, threshold, timeMin, timeMax )edges = diff(vec > threshold);
edgeTimes = find(edges == 1 | edges == -1);
posEdges = find(edges == 1);
if( posEdges(1) == edgeTimes(1) )
edgeTimes = downsample(edgeTimes, 2);
else
edgeTimes = downsample(edgeTimes(2:end), 2);
end
count = numel(diff(edgeTimes) > timeMin & diff(edgeTimes) < timeMax);
end
Results
| Method 1 (error%) | Method 2 (error%) | Fitbit (error%) | ||
|---|---|---|---|---|
| 160 steps | 162 (1.25%) | 159 (-0.625%) | 165 (3.125%) | |
| 140 steps | 150 (7.143%) | 131 (-6.428%) | 144 (2.857%) | |
| 139 steps | 125 (-10.072%) | 114 (-17.986%) | 97 (-30.216%) | |
| 100 false steps (fast shaking) |
64 | 4 | 106 | |
| Average Error | 6.155% | 8.346% | 12.066% |
The first column of the table above states the number of steps we took for each test. This count was achieved simply through counting the number of steps we took per trial. The next 3 columns show the step counting method and resulting error percentage based on the counted steps. The data for method 1 and 2 was collected by starting the android application we wrote to collect accelerometer data at the exact moment the trial began, and immediately stopping it at the end of the trial.
Method 1 resulted in an average error of ~6.155%, which compared to the ~12.066% error of the Fitbit Flex seems to indicate we achieved a more accurate step counting algorithm with method 1. Looking at the results of the Flex, there was an outlier result where the Fitbit counted only 97 steps for a 139 step test. Both method 1 and 2 exhibited a fair amount of error for this trial was well, and we believe this to be a result of minimal hand movement during the trial. In fact, upon returning from trial, our team member reported that he had held is arms tighter to his side than in previous trials.
For the 100 false steps test in which the devices were shaking extremely rapidly for ~100 shakes, method 1 resulted in 64 steps being detected. Our purpose for this test however was to create a scenario in which we believe steps should not be recorded because of the unrealistic frequency at which the devices were shaking. Therefore, method 1 performed quite poorly for this test, though it rejected more steps than the Flex which recorded 106 steps. This seems to indicate that the Flex may not be attempting to reject unrealistic data from its step count.
The novel embedded platform approach faired really well with an average error of 8.346% over the test suite. This was more accurate than the Fitbit. Furthermore, on the 100_fake test, method 2 was able to reject most of the steps. This was due to the time windowing, which rejects possible steps that are either too fast or too slow, which effectively filters the incoming data, real-time, without convolution or FFT. Method 2 has comparable results to method 1 for actual steps and rejects nearly all of the fake step making method 2 the most effective.
Conclusion
The embedded approach was more successful than expected. Not only did it out perform the Fitbit, method 2 was significantly less computationally expensive than method 1. The final version of method 2 was the product of many iterations, most of the work done for previous iterations is included in a method2.zip but is mostly unused. Although there was a significant amount of unused extra code, including the short time digital filter, it was a good learning experience. The final version of method 2 stood on the shoulders of all of the previous iterations.
Method 2 is not done, the parameters, threshold timeMin and timeMax, need to be tuned based on an anatomical model of walking and running and/or a much larger data set. The current choices for the parameters we chosen to best represent the steps taken in our test suite. If more time is put into the tuning of the parameters method 2 look like a very effective method for step counting.
References & Downloads
- Download - full submission
- Download - modified app source
- Download - modified androidAPP.m
- Download - method1.m
- Download - method2.zip
- Download - 160_steps.txt
- Download - 140_steps.txt
- Download - 139_steps.txt
Authors
Jason Shintani, Kevin Kiningham, Kevin Wei, Richard Ortman