Joshua Monthei
UP 504 Assignment 3

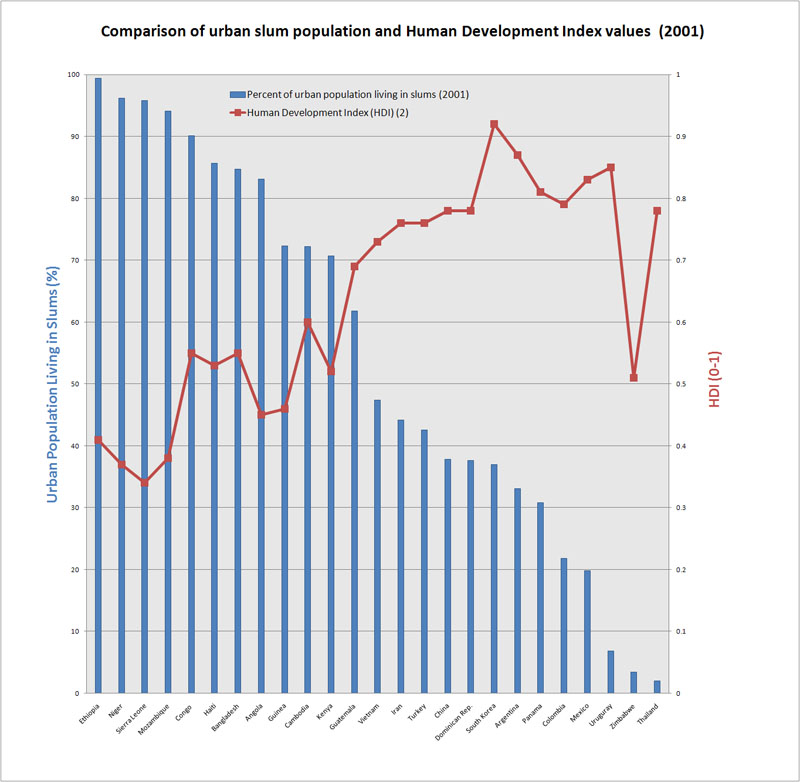
Table 1: Urban slum dwellers, Gini Coefficient (1),
Human Development Index (2), GDP, and life expectancy
for
25 randomly selected countries in Africa, Asia, and Latin America
, 2001

COUNTRY Percent of urban population living in slums (2001)

Gini Coefficient
(1)

Human Development Index (HDI) (2) Gross Domestic Product (millions of USD) Life Expectancy
Ethiopia 99.4 30 0.41 13,315 49.2
Niger 96.2 50.5 0.37 3,601 56.9
Sierra Leone 95.8 62.39 0.34 1,420 40.6
Mozambique 94.1 47.3 0.38 7,738 40.9
Congo  90.1 61.3 0.55 8,543 55.3
Haiti 85.7 59.2 0.53 4,473 57
Bangladesh 84.7 33.4 0.55 64,854 62.8
Angola 83.1
n/a
0.45 45,167
42.7
Guinea 72.3 38.6 0.46 3,140 56
Cambodia 72.2 41.7 0.6 7,272 61.3
Kenya 70.7 42.5 0.52 22,819 54.1
Guatemala 61.8 55.1 0.69 30,299 69.7
Vietnam 47.4 34.4 0.73 60,995 71.1
Iran 44.2 43 0.76 222,387 71
Turkey 42.6 43.6 0.76 401,763 72.9
China 37.8 47.1 0.78 2,644,642 73
Dominican Rep. 37.6 51.6 0.78 31,600 73.1
South Korea 37 31.6 0.92 888,267 77.2
Argentina 33.1
51.3
0.87 212,595 76.3
Panama 30.8 56.1 0.81 17,103 75.2
Colombia 21.8 58.6 0.79 135,883 72.9
Mexico 19.8 46.1 0.83 840,012 75.6
Uruguay 6.9 44.9 0.85 37,540 76.4
Zimbabwe 3.4 56.8 0.51 5,540 39.5
Thailand 2 42 0.78 206,338 70.6

1. The Gini Coefficient is a statistical measure of the inequality of income distribution,
with zero corresponding to perfect income equality and 100 corresponding to total inequality.
More information on the Gini Coefficient is available here: Gini Coefficient Wiki

2. Developed by a group of economists in the 1990s, HDI is a normalized measure of
life expectancy, literacy, education, standard of living, and GDP per capita for countries.
More information on HDI is available here: HDI Wiki

Sources::
United Nations Human settlements Programme: Compendium of Human Settlements Statistics, Statistical Annex to the Global Report and the State of the World's Cities Report 2001 UN Habitat

World Bank Development Indicators Database (2007) World Bank