
| [1] Parameteric Subharmonic Instability in a global model (Ansong et. al, 2018) | |
| On-going research is trying to understand the dynamic processes befalling internal tides before they finally dissipate. One such process is called Parameteric Subharmonic Instability (PSI), whereby a primary wave (the internal tide in this case) may lose energy to daughter waves with smaller vertical scales and with nearly half the frequency of the primary wave (McComas and Bretherton 1977). We examine whether PSI occurs in a high-resolution global model, forced by both atmospheric analyses fields and tides, and whether PSI accounts for a significant fraction of the tidal baroclinic energy loss. | |
| [Top] Predicted semidiurnal tidal signal of North-South baroclinic velocity close to location MP3 around Hawaii (longitude = 196.5 degrees East). [Middle] Same as top panel but after bandpassing around the subharmonic frequency band (half tidal frequency) for near-inertial waves. Observe high vertical wavenumber structures in the upper ocean around the critical latitude (white vertical line). [Bottom-left] A vertical profile through the M2 critical latitude (28.8 degrees North) from the middle panel, showing the vertical scale of the near-inertial waves. [Bottom-right] A horizontal slice from the bottom-left panel through 1000m depth, showing the horizontal scale of the subharmonic signals in the critical latitude band (25-30 degrees North). | |
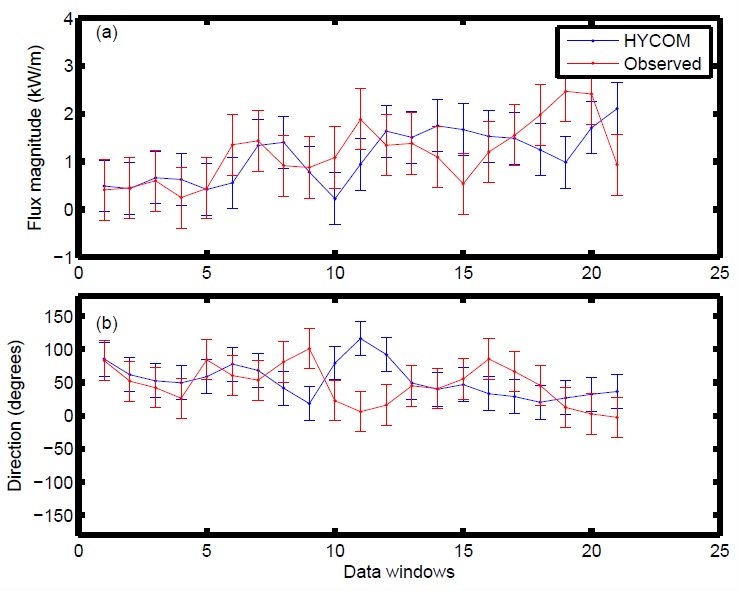
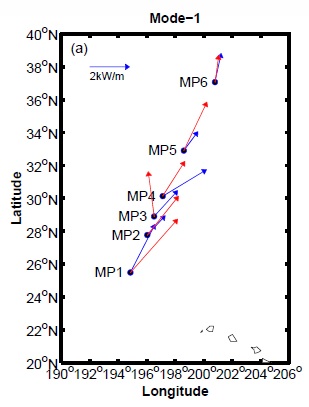
| [2] Variability of semidiurnal internal tides | |
| The root-mean-square (RMS) variability of the semidiurnal internal tide energy flux is large in both a global model, HYCOM, and moored observations. The normalized RMS variability (the RMS variability divided by the mean) is of order 23% or more in both the model and observations. The model fluxes agree more closely with the high-resolution observed (IWAP) fluxes than with those derived from historical moorings [see Ansong et al. (2017)]. | |
|
|
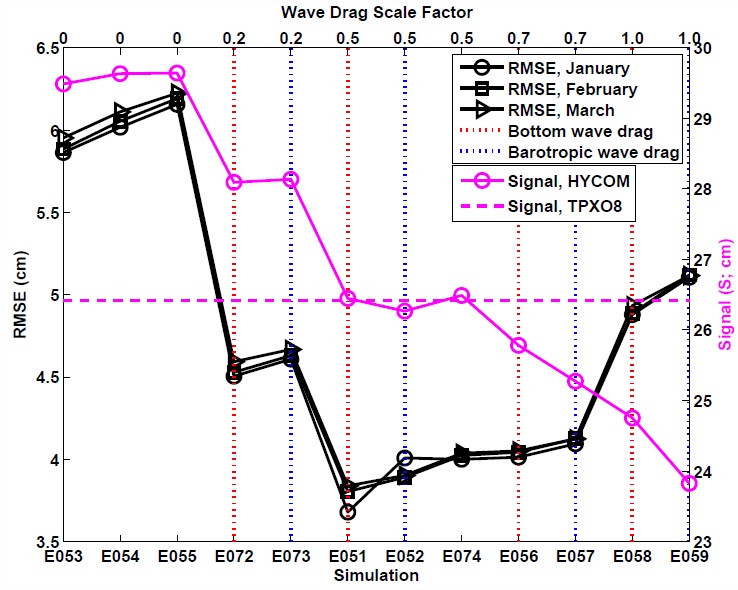
| [3] Importance of parameterized wave drag in global ocean models | |
| Without a parameterized internal wave drag in high resolution global ocean models, both the barotropic and baroclinic tides become too energetic, compared to TPXO and along-track altimeter data, and travel too far from their generation regions [see Ansong et al (2015)]. | |
|

|
Some previous research: laboratory tank experiments
| [4] Internal gravity waves generated by convective plumes | |
| Movie: Internal gravity waves are generated when a turbulent plume, moving through a uniform ambient fluid (upper gray part of tank), impinges and penetrates a uniformly stratified layer of fluid. The waves radiate from the density interface as conical beams and finally reflect off the tank walls [J.K. Ansong and B.R. Sutherland, JFM, 2010]. | |
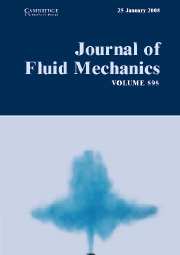
| [5] Turbulent Fountains in a two-layer fluid | |
|
JFM cover figure: A laboratory tank experiment of a turbulent fountain penetrating the interface between two density layers, and reversing to spread along the neutral density level [J.K. Ansong, P. Kyba and B.R. Sutherland, JFM, 2010]. |