|
|
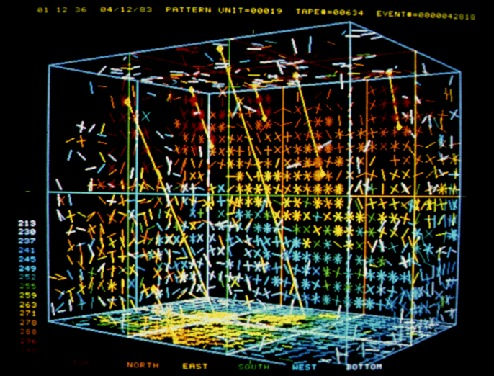
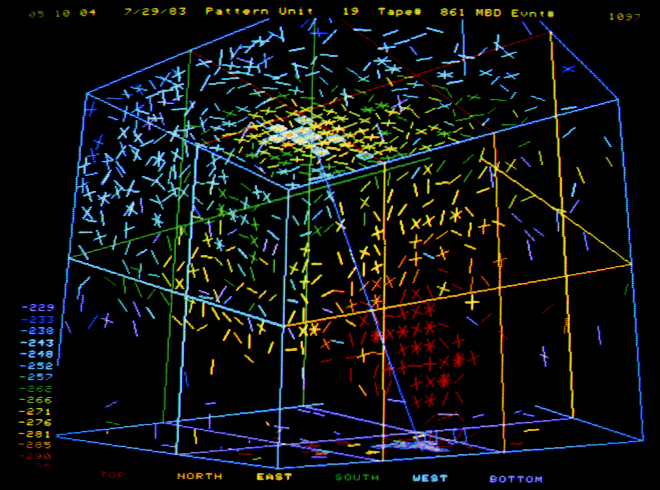
This computer image shows seven cosmic ray
muons (yellow lines) going through the detector simultaneously.Charged
particles like these emit a cone of Cherenkov light which
travels through the water and hits the photomultiplier tubes (PMT's)
covering the six walls of the detector. Each slash represents
one Cherenkov photon hitting a PMT. The colors indicate the time
the PMT was hit. The color scale at left gives the time in nanoseconds
(ns). The scale is negative, starting around -300 ns and ending
around -220 ns. A typical cosmic ray takes about (300-220)=80
ns to traverse the 80 ft detector at a speed of about one foot
per ns (essentially the speed of light).
The paths of the muons are reconstructed from
the PMT data to within an accuracy of a few degrees.
|
|
|
The above 7-muon event is rare..... muons usually
go through one or two at a time.
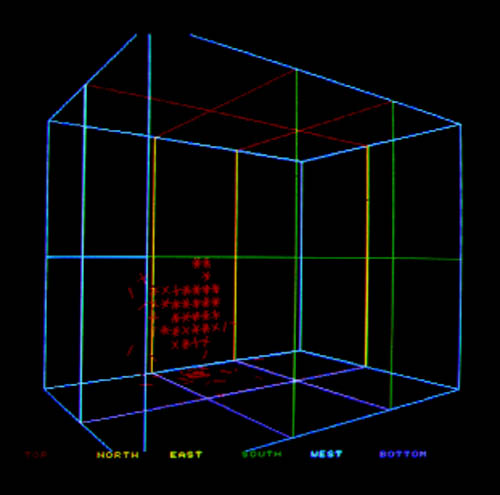
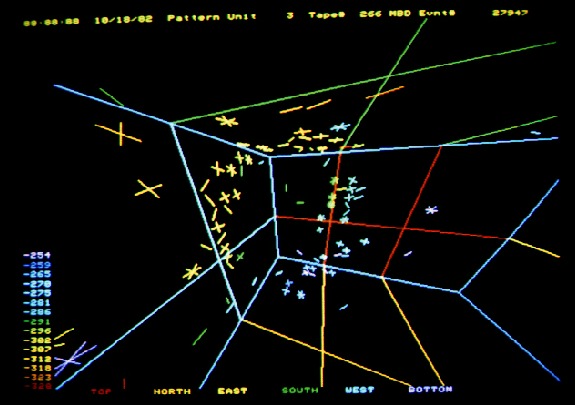
The event at left is even rarer, occurring only
about once a week. It is a muon going through upwards from the
BOTTOM (indicated by purple rectangles)
and exiting at the TOP (red rectangles).
This muon was not generated in the atmosphere
above (like the down-going ones) but in the earth itself below
the detector. A high energy neutrino generated in the atmosphere
on the other side of the world passed all the way through the
earth and happened to interact just below the detector to produce
the up-going muon.
|
| |
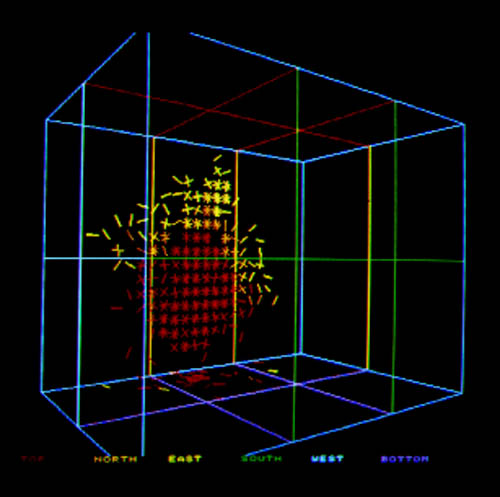
This event is also an upward-going muon that enters
the BOTTOM near the NORTH wall (back wall in this view). The muon
doesn't go all the way through the detector but skims along the
NORTH wall and stops in the water about 2/3 the way through.
This muon generates a Cherenkov cone that can be
seen developing in time by mousing-over
(not clicking) on the buttons.
The yellow squares in picture 5 show where the outside
of the Cherenkov cone intersects the NORTH, TOP, and EAST walls.
The pictures are about 20 ns apart in time.
|
NOW.... HOW TO DETECT DECAYING
PROTONS:
The pictures below illustrate four different
ways to view the same event,
an upward-going muon which starts inside the detector and goes
about 7 ft
before slowing down and stopping in the water.
The muon was produced by an upward-going neutrino which interacted
with a nucleon (proton or neutron) in the water.
Such tracks make a single thin Cherenkov cone which lights up a ring
of PMT's.
The cone has a (half) opening angle of 41 deg so
the size of the ring of tubes will depend on how far away from the wall
the track started.

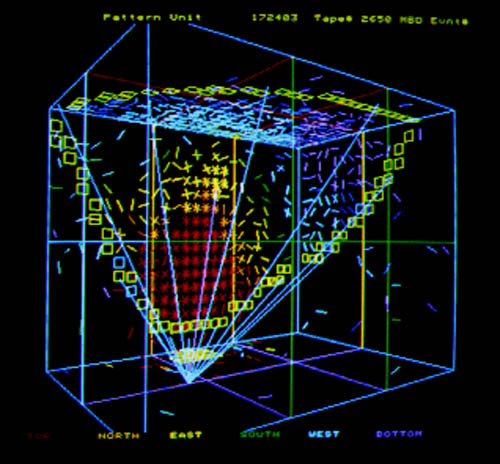
Looking down into the tank we see
a large Cherenkov ring hitting the TOP, SOUTH, WEST, and NORTH
walls. It's difficult to discern a ring in this view.
|
The ring is much easier to see in
this "fisheye" view in which the observer's eye
is put at the origin of the muon track.
|
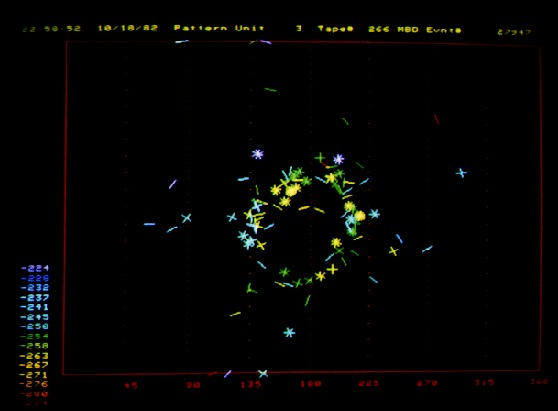
In this view the PMT hits are projected
onto a cylinder whose center is at the "fisheye".
The cylinder is then unrolled to be a plane. The blue and purple
hits are due to photons that scattered in the water before hitting
the walls. Their color indicates they arrived much later than
the green and yellow hits of the
main ring.
|
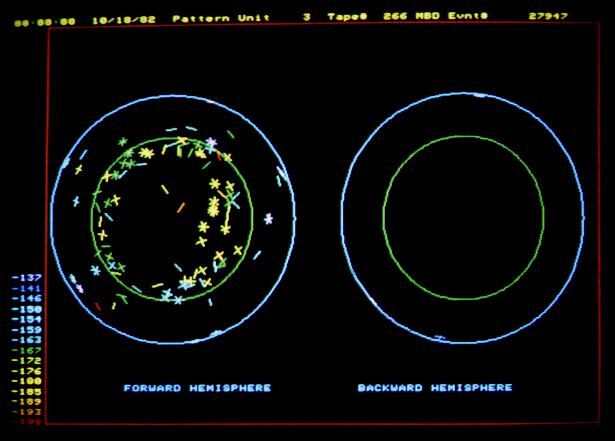
This shows the
hits are projected onto a sphere whose center is at the
fisheye. The sphere is then opened up so the ring is in the "forward"
hemisphere. The green ring is the outer edge of an ideal 41 degree
Cherenkov cone. A perfect track in a perfect world would have all
the hits be the same color and just inside of the green circle.
Note that the "backward"
hemisphere is empty for this single-track event. It represents only
one-half of what would be seen in a true proton decay event.
Protons are essentially at rest in
the water and their decay must result in at least two new particles
going in opposite directions. We use this feature to distinguish
proton decays from neutrino interactions in the water.
This is illustrated below.
|
 |
The initial version of the IMB detector was designed
to look for one of the simplest modes:
a proton decaying into a positron (e+) and a neutral pion
(pi0). These particles would give rise to two Cherenkov cones
going in opposite directions.
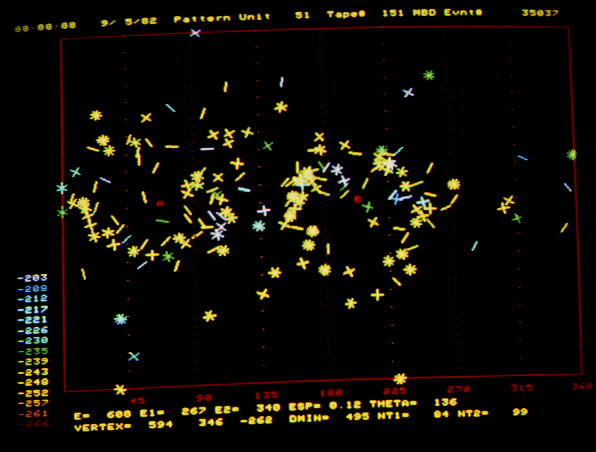
The event at left is an artificial ("monte
carlo") event which gives an example of what a real proton
decay into e+ and pi0 would look like on the cylinder
plot. The two rings are not very well-defined here because the electromagnetic
showers produced by the e+ and pi0 contain several electrons and
positrons with scattered directions.
The two red A
and B
points are where the computer estimated the centers of the
two showers were pointed. The calculated angle between the shower
directions was 160 deg., which is near the 180 deg. angle at which
they were generated.
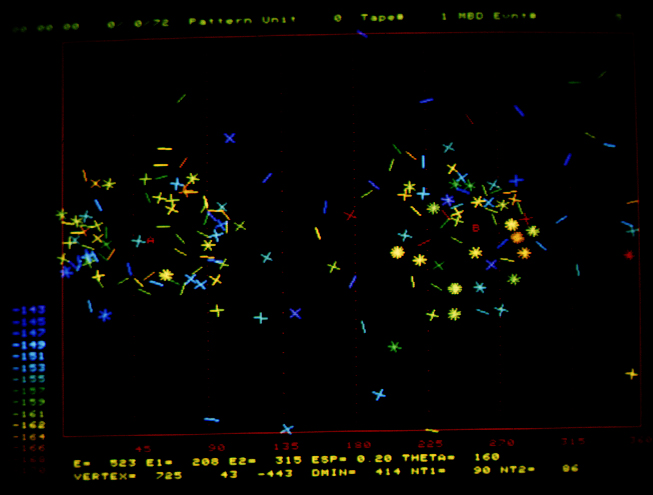
A real event which is similar to this one
is seen in the cylinder plot on the left below.
|
The three pictures below are three views
of an event we recorded in our first few months of running
in the fall of 1982. It looks quite similar to the above simulated event,
so naturally we were quite
excited when we first saw it. On closer inspection, however, the event
has three properties
that don't match proton decay. Any one of these is sufficient to
reject it.
These properties are explained below the pictures.
|
This cylinder plot shows one fatal
property of this event:
It has too much total energy.
Qualitatively one can see many more total slashes than on the plot
above it. Quantitatively it's total energy is estimated to be 1230
MeV, too far from the 938 MeV value expected from a proton decay.
|
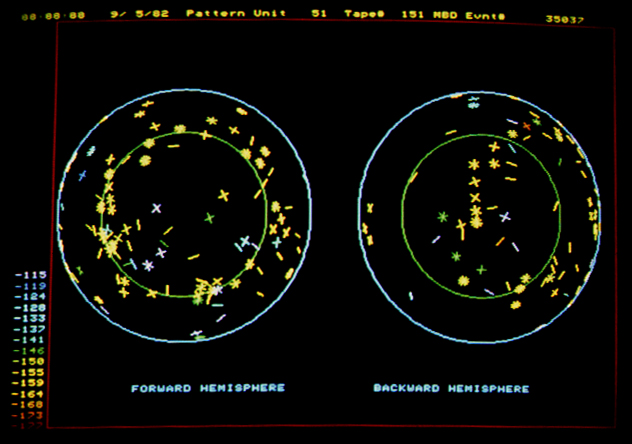
Secondly, it's clear from this sphere
plot that the two showers are not 180 deg apart. In fact the measured
angle between A and
B on the cylinder plot is only 135 deg: too far
from the expected 180 deg of a proton decay at rest.
|
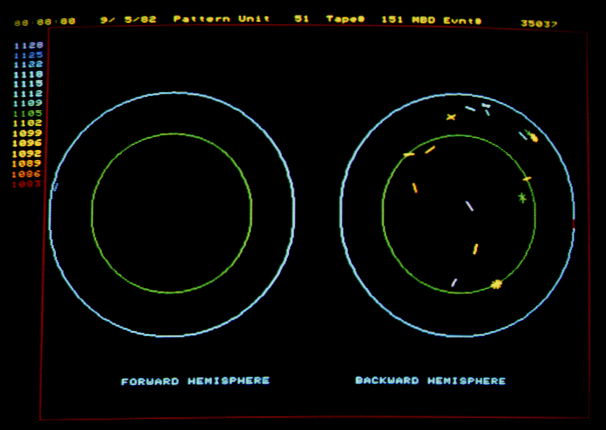
This particular event has a third
fatal flaw:
The IMB detector had a "T2 time
scale", designed to capture the signal from a muon decaying
into an electron a few microseconds after the main event.This would
indicate that one of the tracks in the main event was a muon. A
picture of the T2 time scale above clearly shows a signal of an
electron in the vicinity of the backward-hemisphere track on the
sphere plot, so this event can not be due to an (e+,pi0) decay mode.
It could perhaps be a (mu+,pi0) mode but then the energy and angle
requirements would still rule it out.
|
So
if the above event is not a proton decay, what is it?
|
The above event is one of 69 that
were found inside the IMB detector in its first 80 live days of
operation.
This event rate agreed (within a factor of two) with expectations
due to neutrino interactions in the water.
The neutrinos are produced by cosmic rays hitting the atmosphere
all around the Earth.
Billions of them pass through the detector every second and from
every direction.
About once per day a neutrino will interact in the water producing
some charged particles which leave telltale Cherenkov rings.
Of the first 69 events only three
vaguely resembled the hypothesized proton decay into (e+,pi0).
Upon closer examination all of them, including the one pictured
above, were eliminated.
With no viable candidates we were able to determine that the lifetime
of the proton,
for this decay mode, was at least 6.5 X 10^31 years.
This result was published in the
first IMB paper in 1983. The title page is shown below.
By this time the collaboration had grown to 29 members,
including 11 graduate students who contributed greatly to the
success of the project.
|
|
|
For more pictures click
here
and search for "Vander
Velde"
Go to top of:
Page1
Page 2
This page (3)
Page 4
|