Plots Made for the
RoPP Review Article on Dark Energy
This page contains original plots made for our Reports on Progress in
Physics review paper on dark
energy.You are welcome to download and use these plots in your talks and papers; in that case please cite:
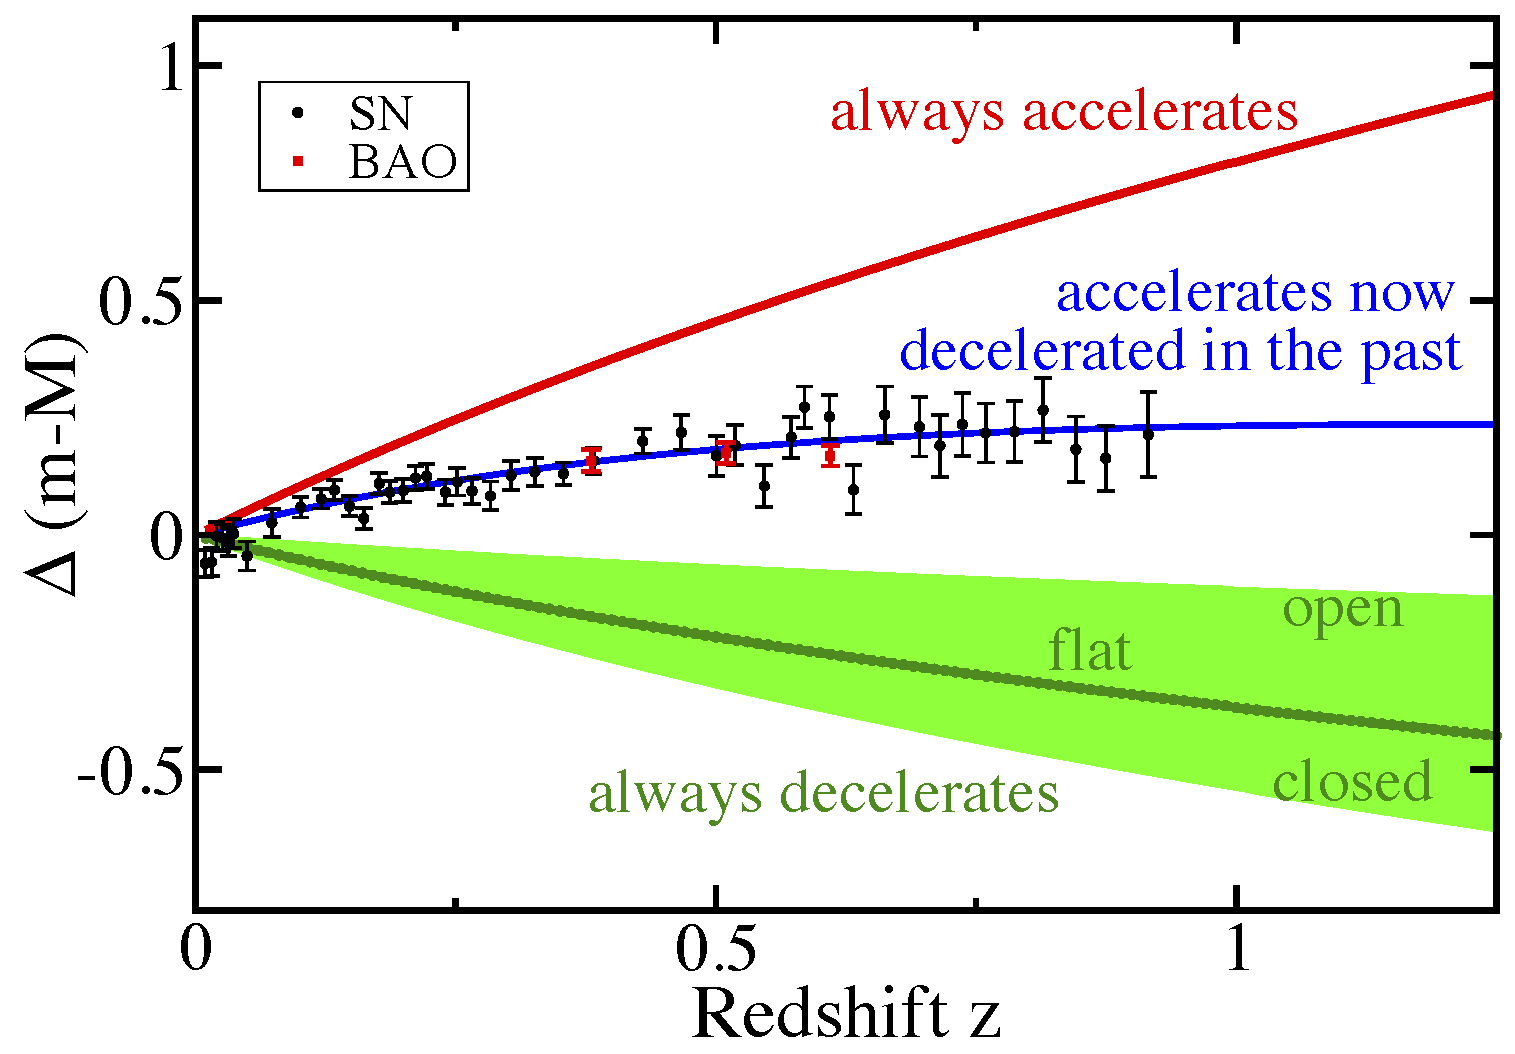
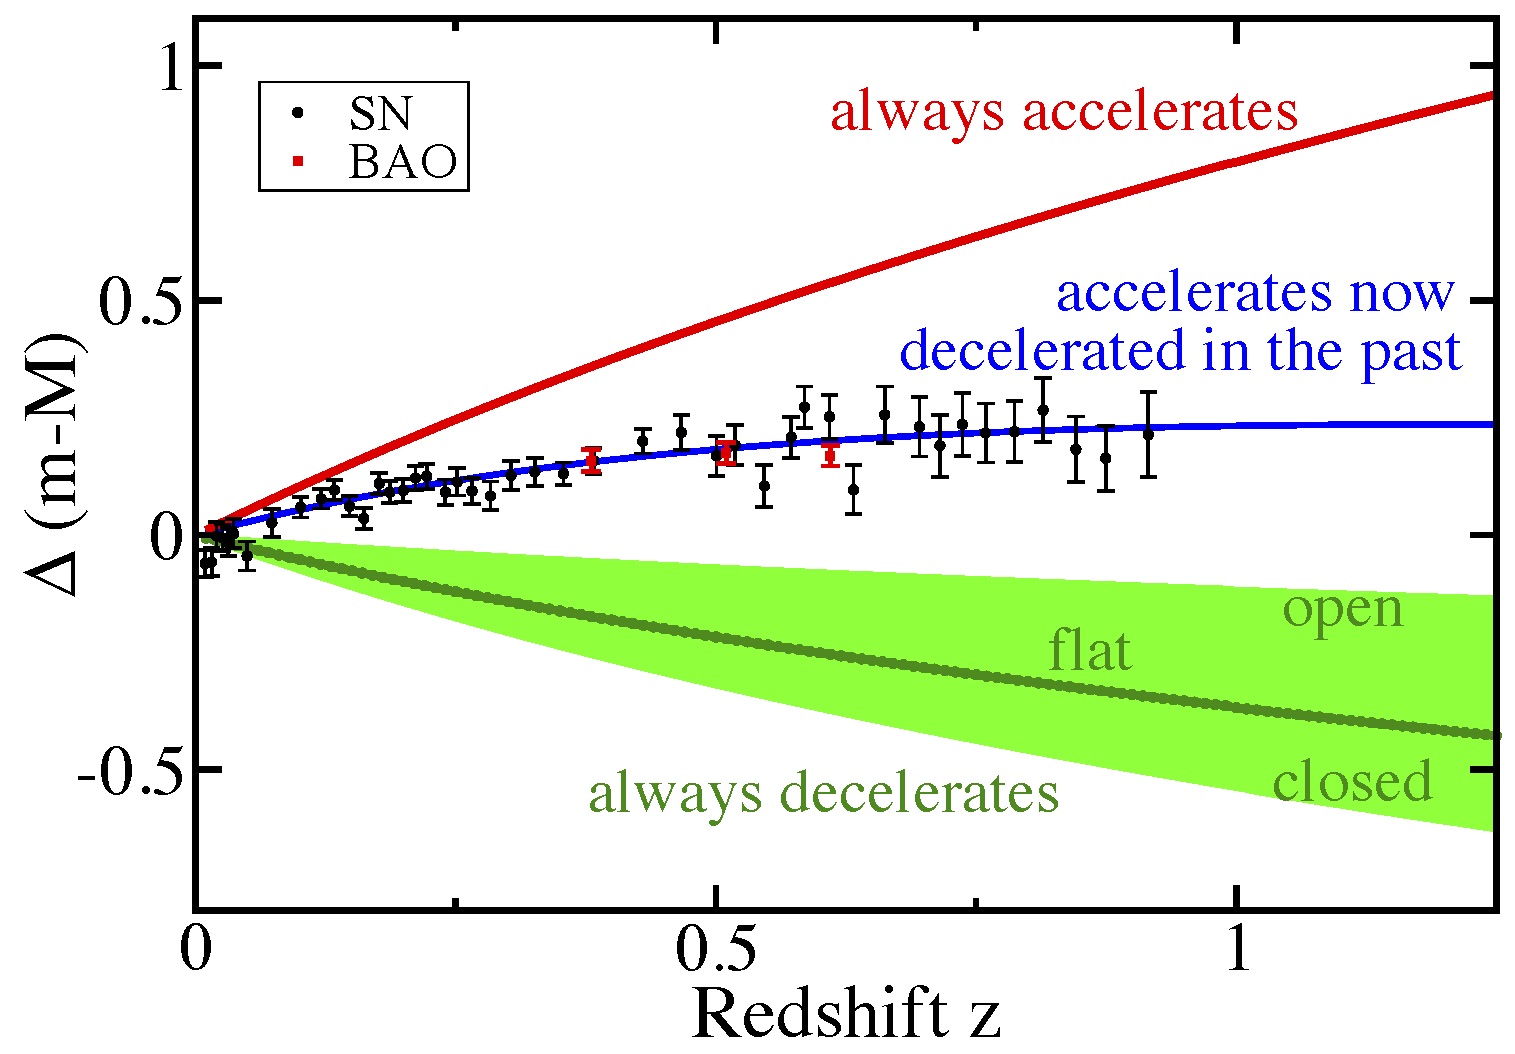
Hubble diagram with current (binned) SNIa and BAO data:
-
File formats:
- jpeg (237 kb)
- png (68 kb)
- pdf (56 kb)
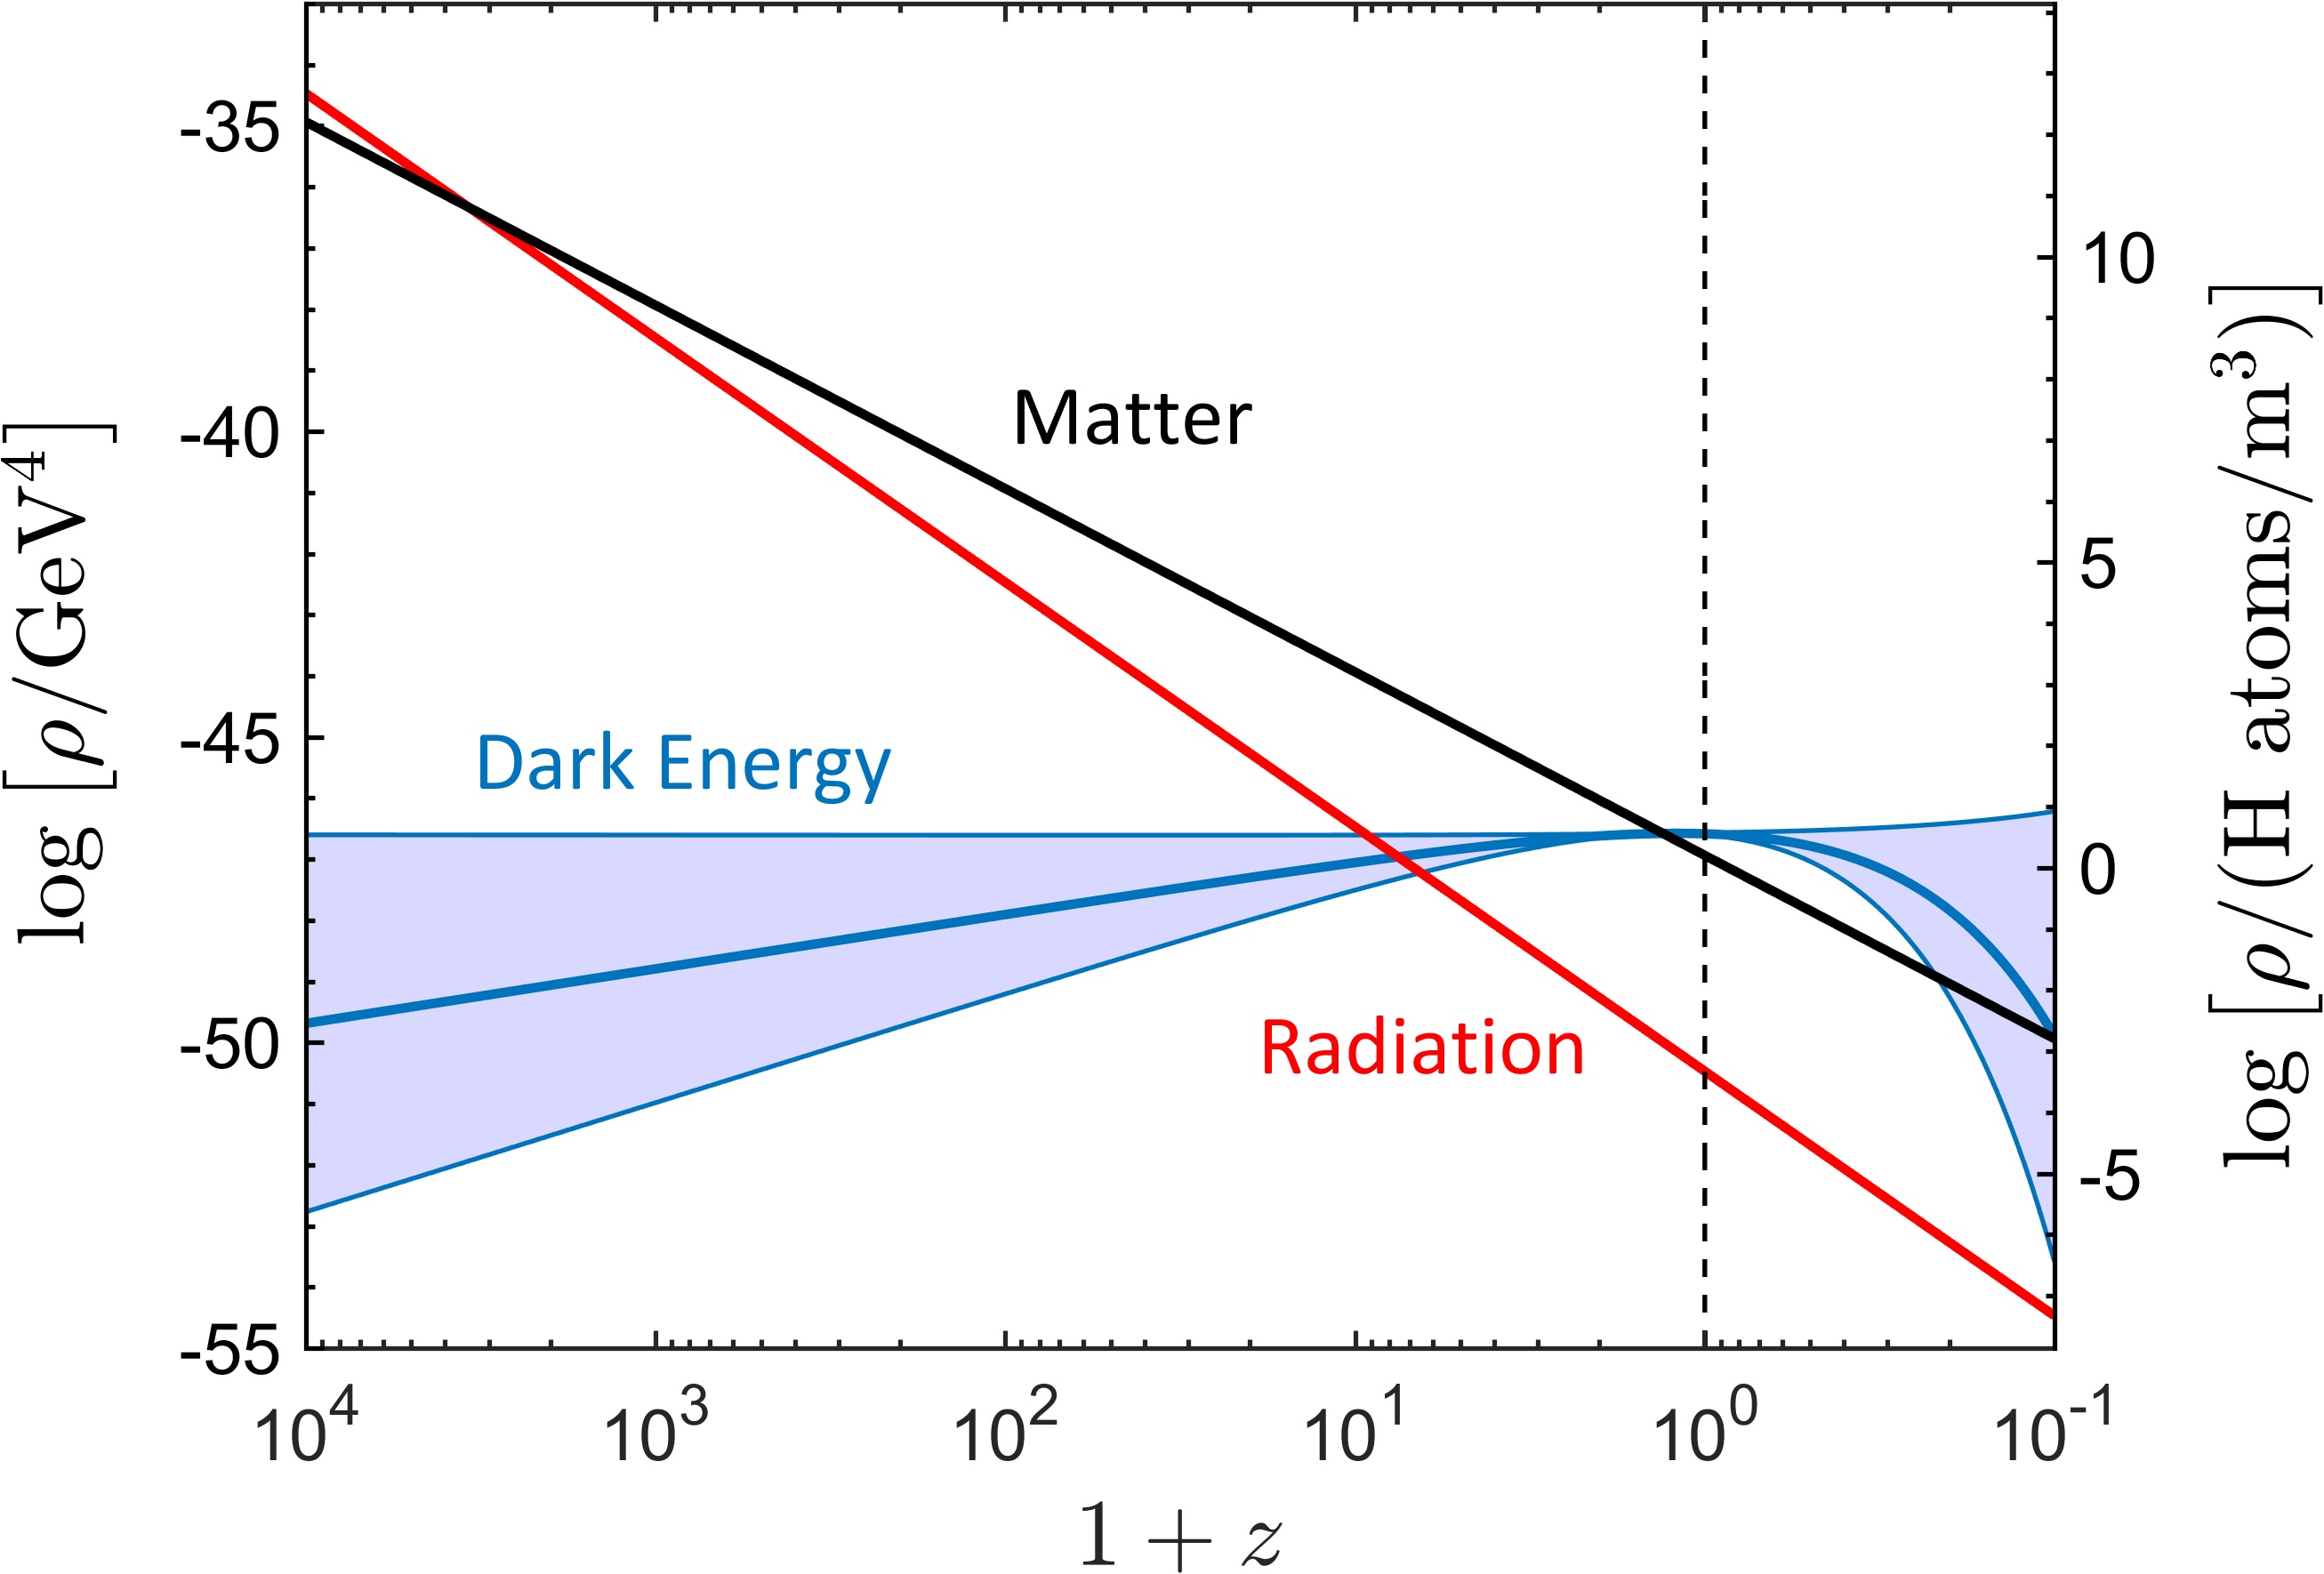
Energy densities vs. redshift:
-
File formats:
- jpeg (354 kb)
- png (173 kb)
- pdf (213 kb)
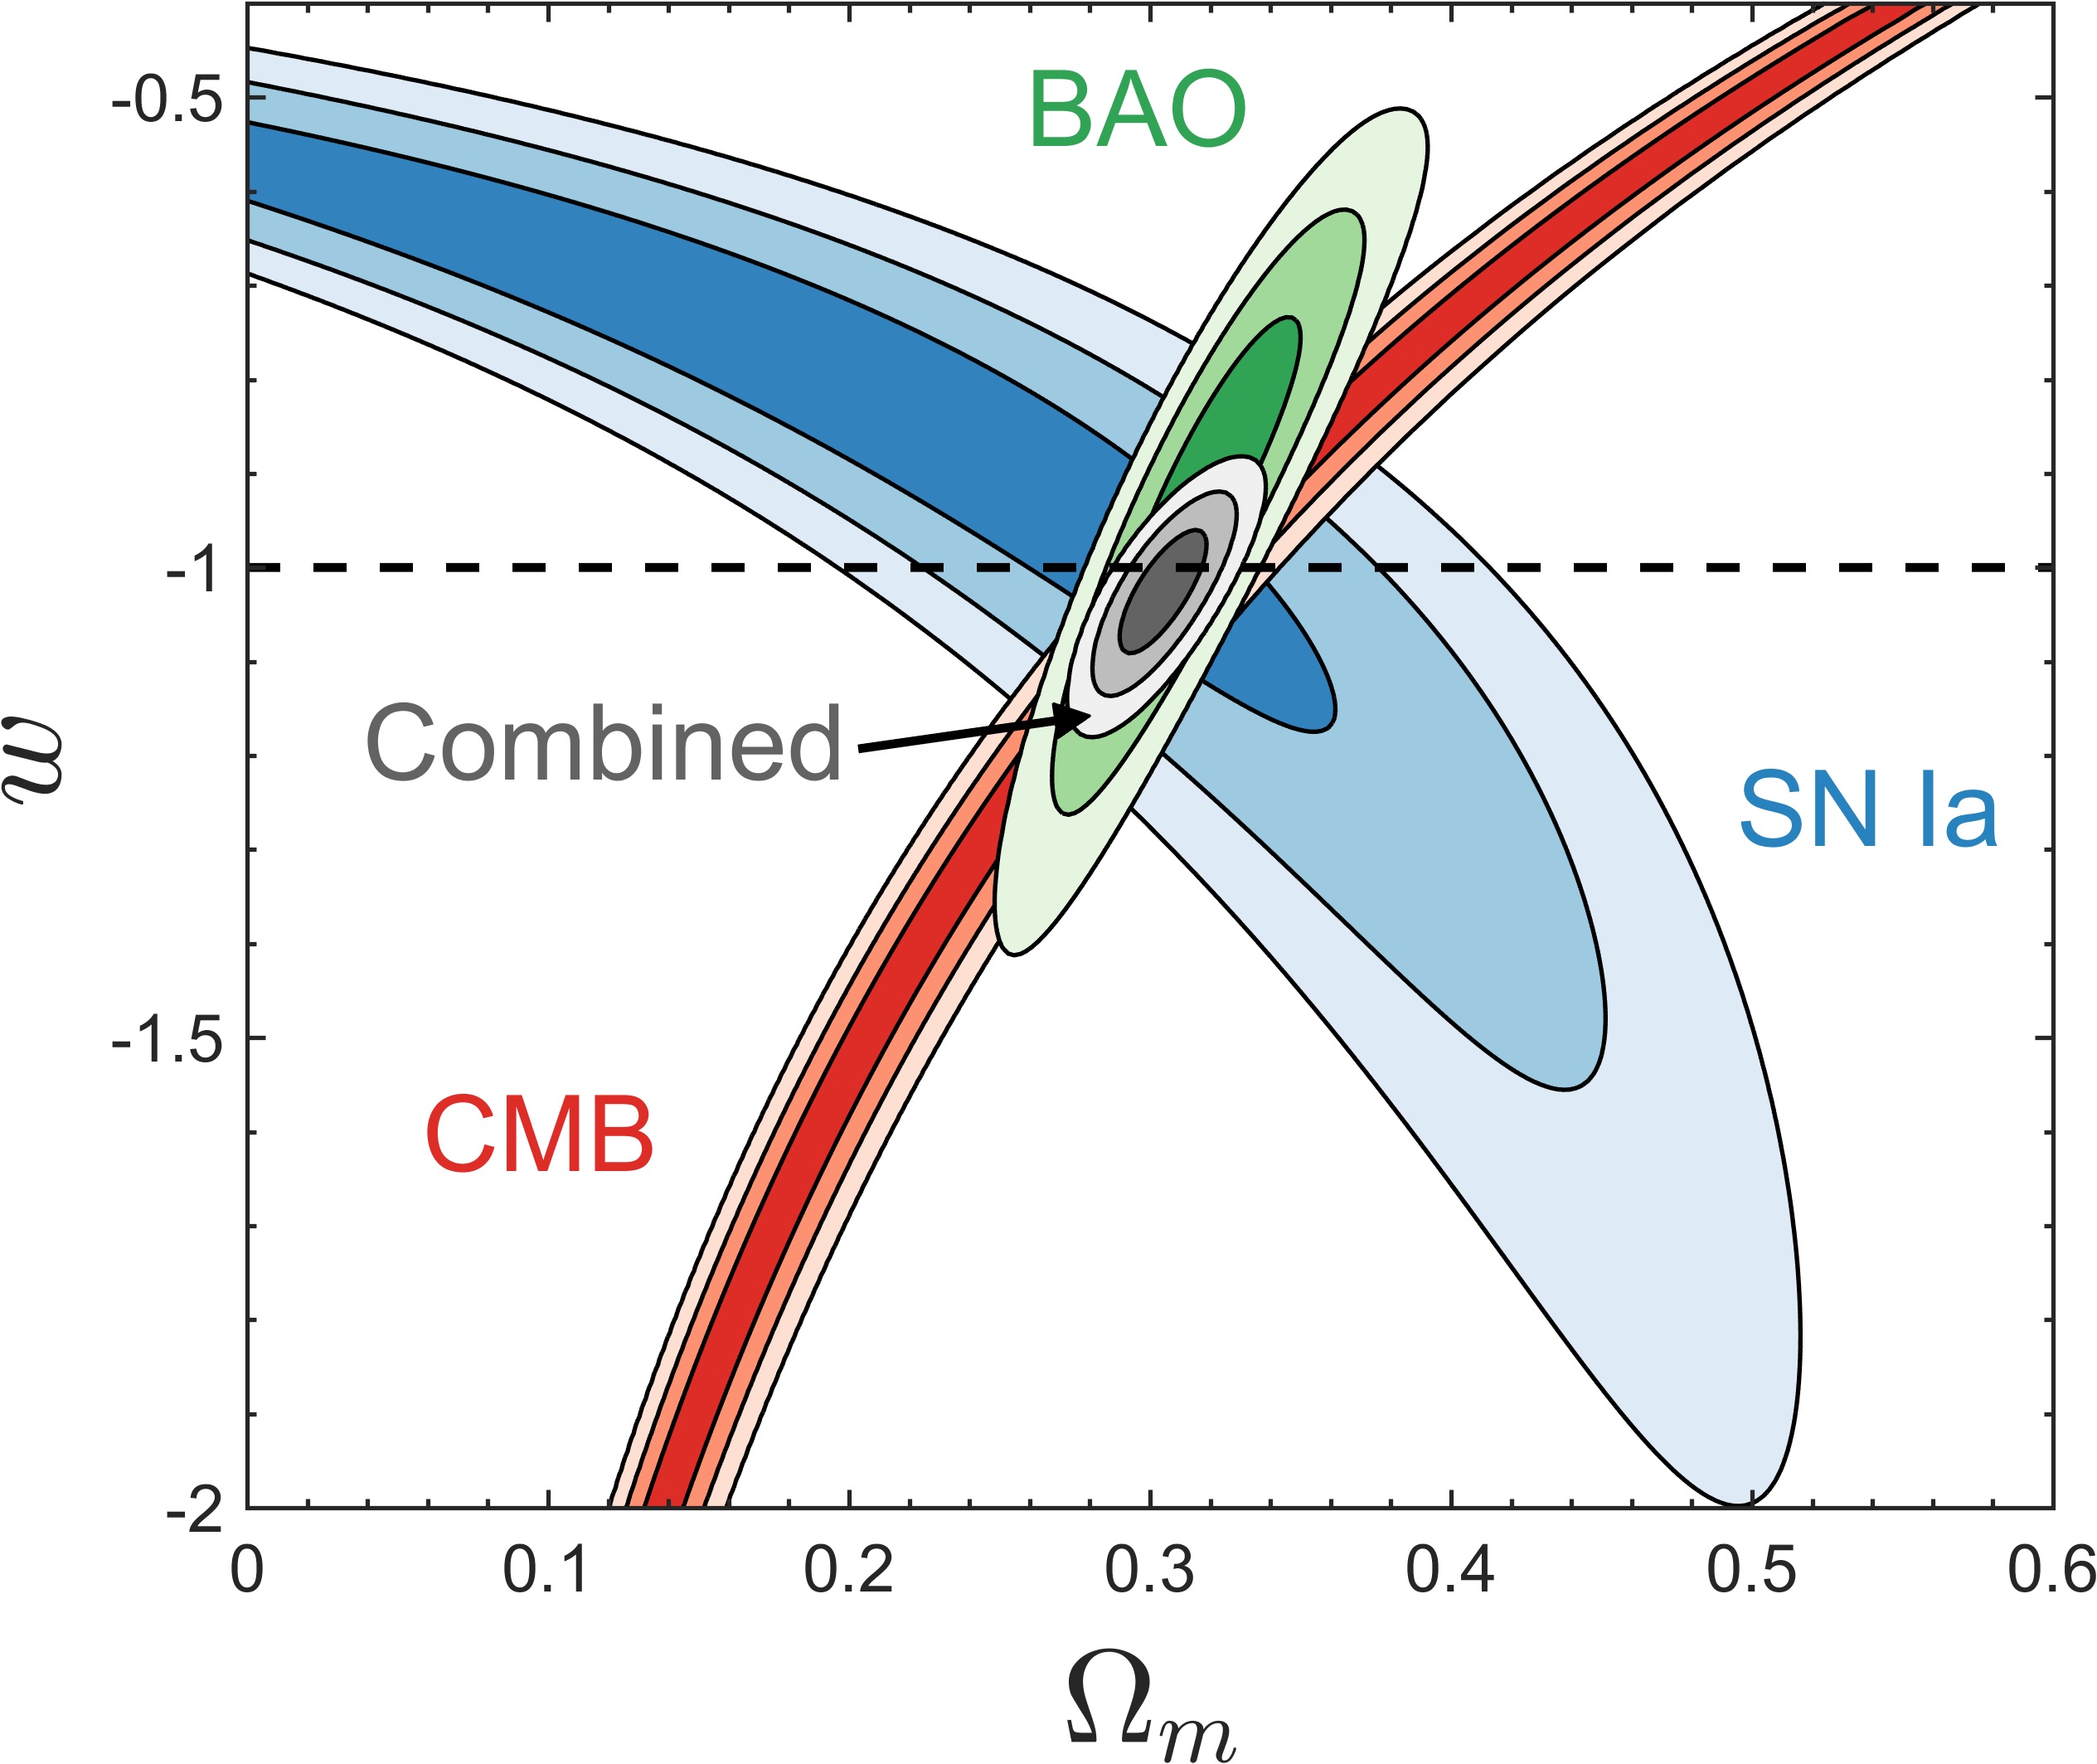
$\Omega_M$-$w$ plane, current constraints:

-
File formats:
- jpeg (530 kb)
- png (307 kb)
- pdf (335 kb)
$\Omega_M$-$w$ plane, historical constraints (1999-2009-2015):
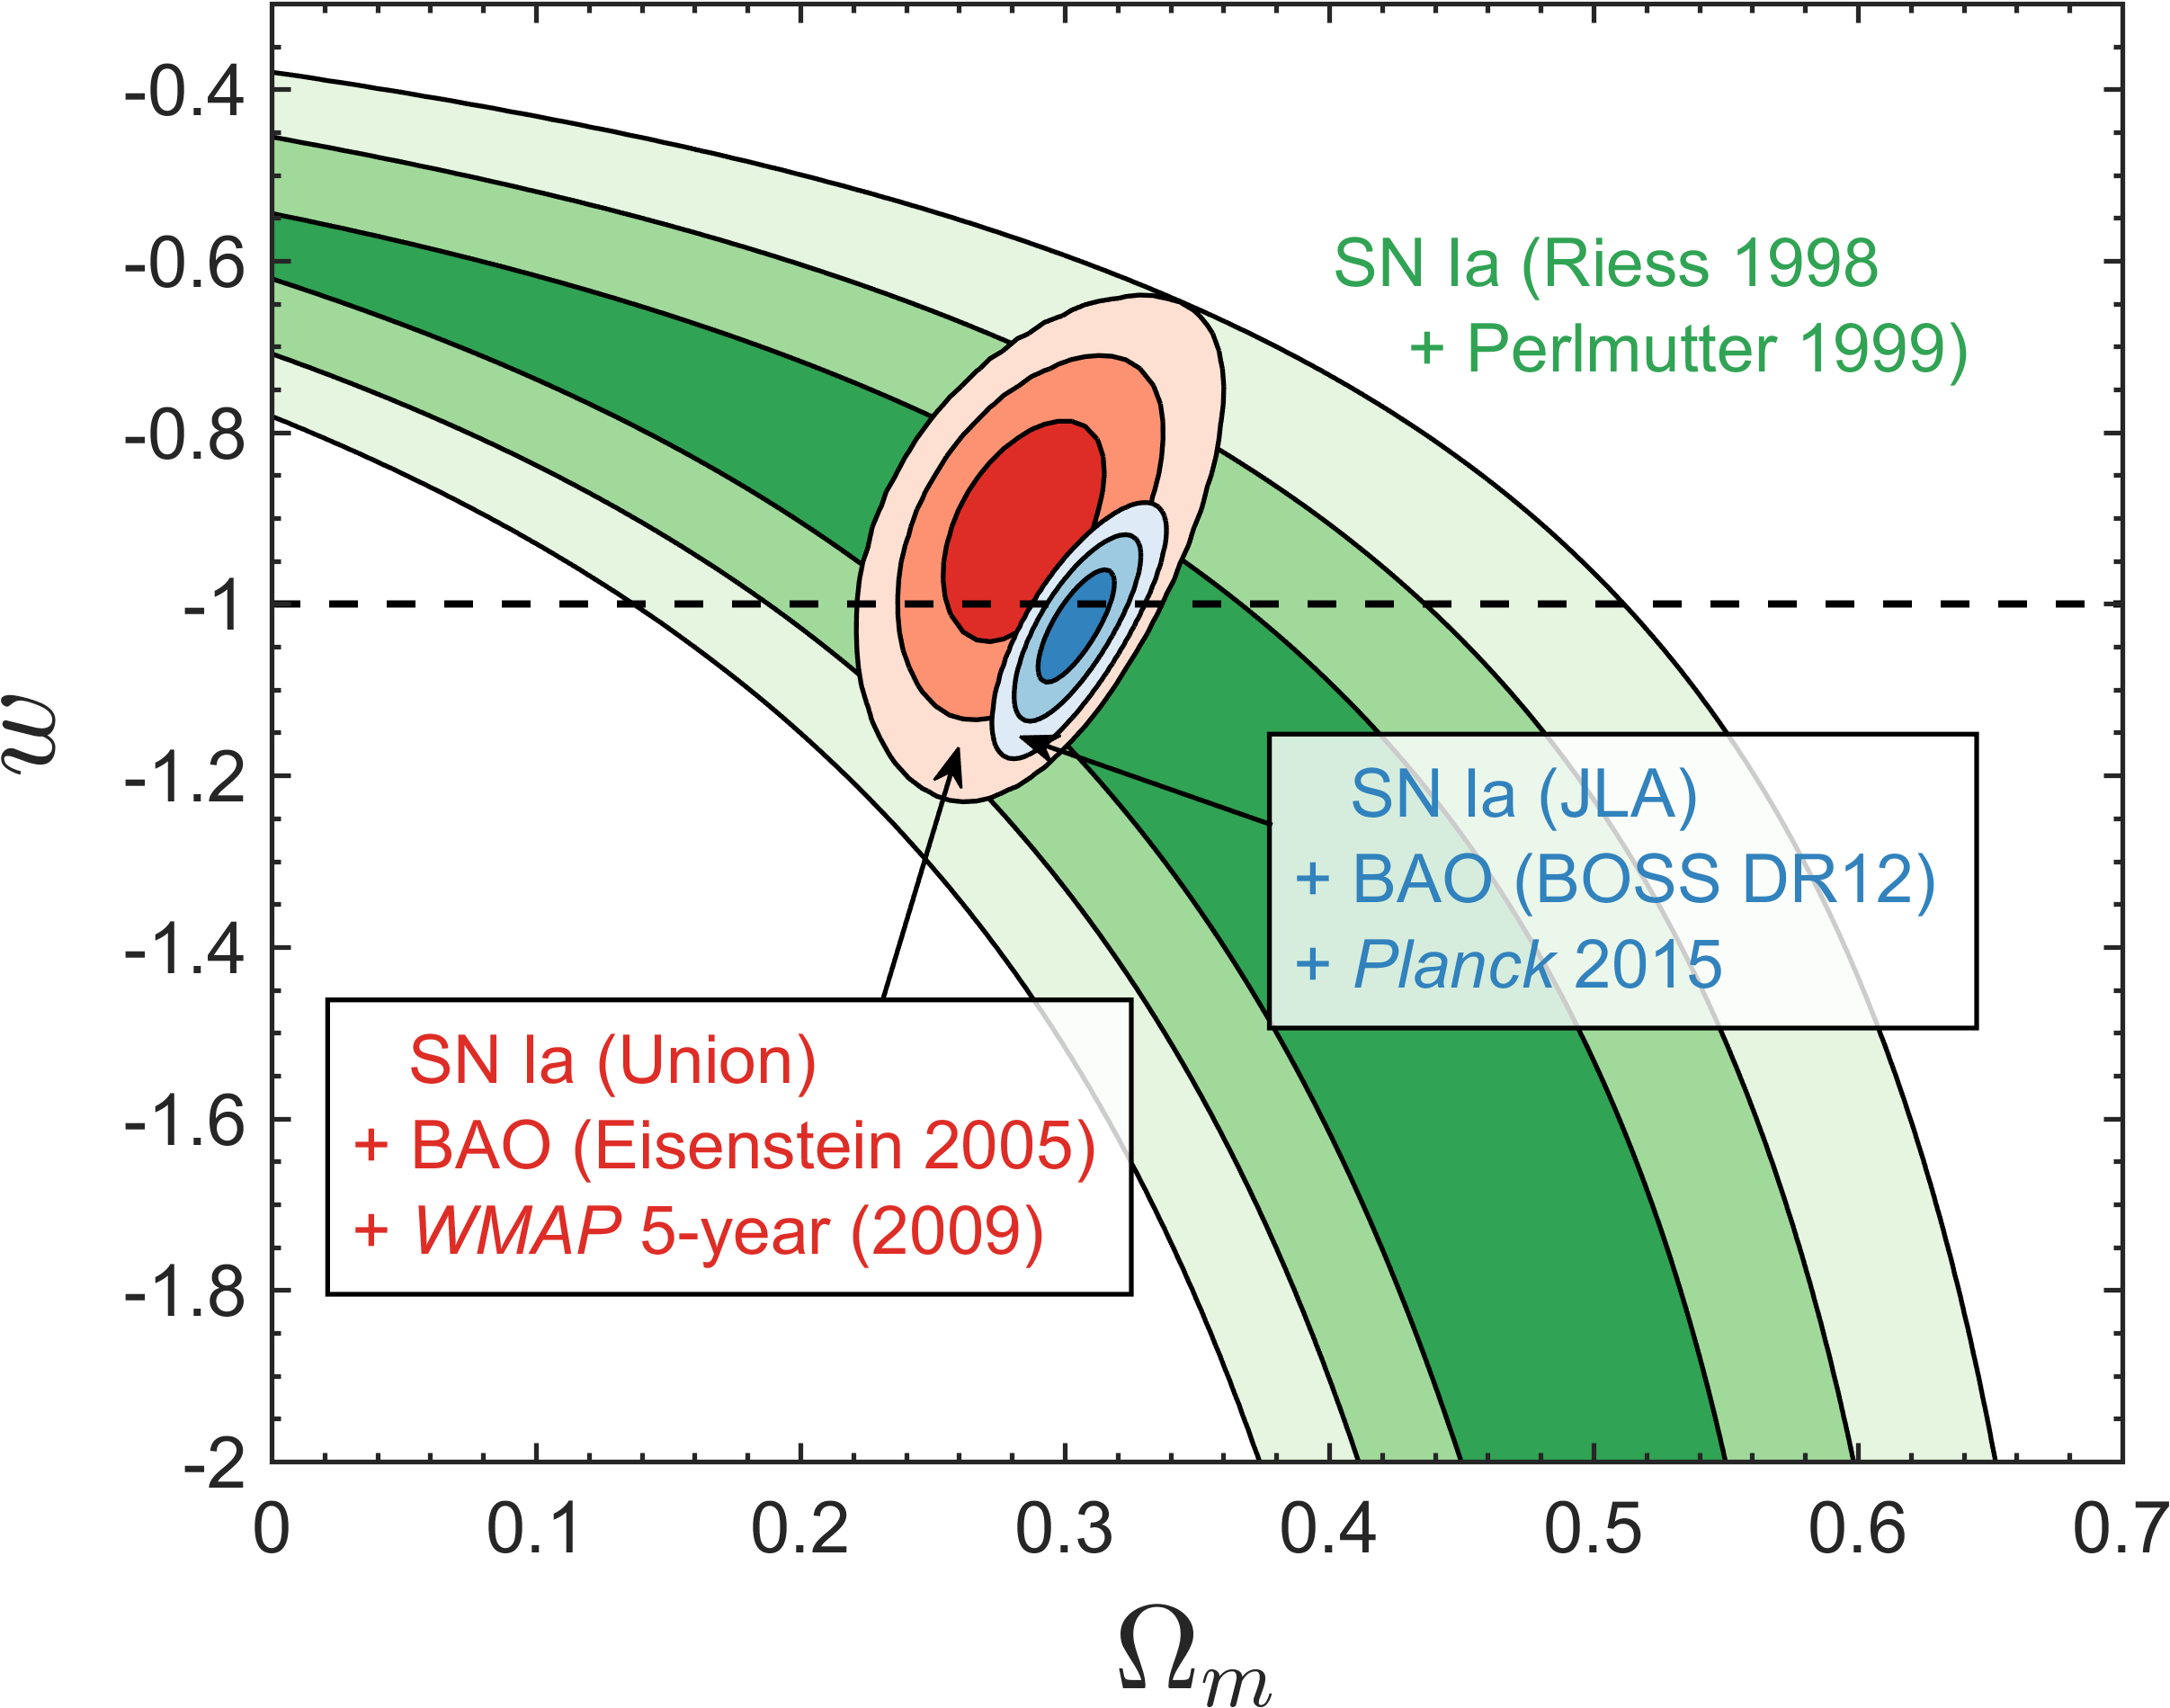
-
File formats:
- jpeg (501 kb)
- png (308 kb)
- pdf (321 kb)
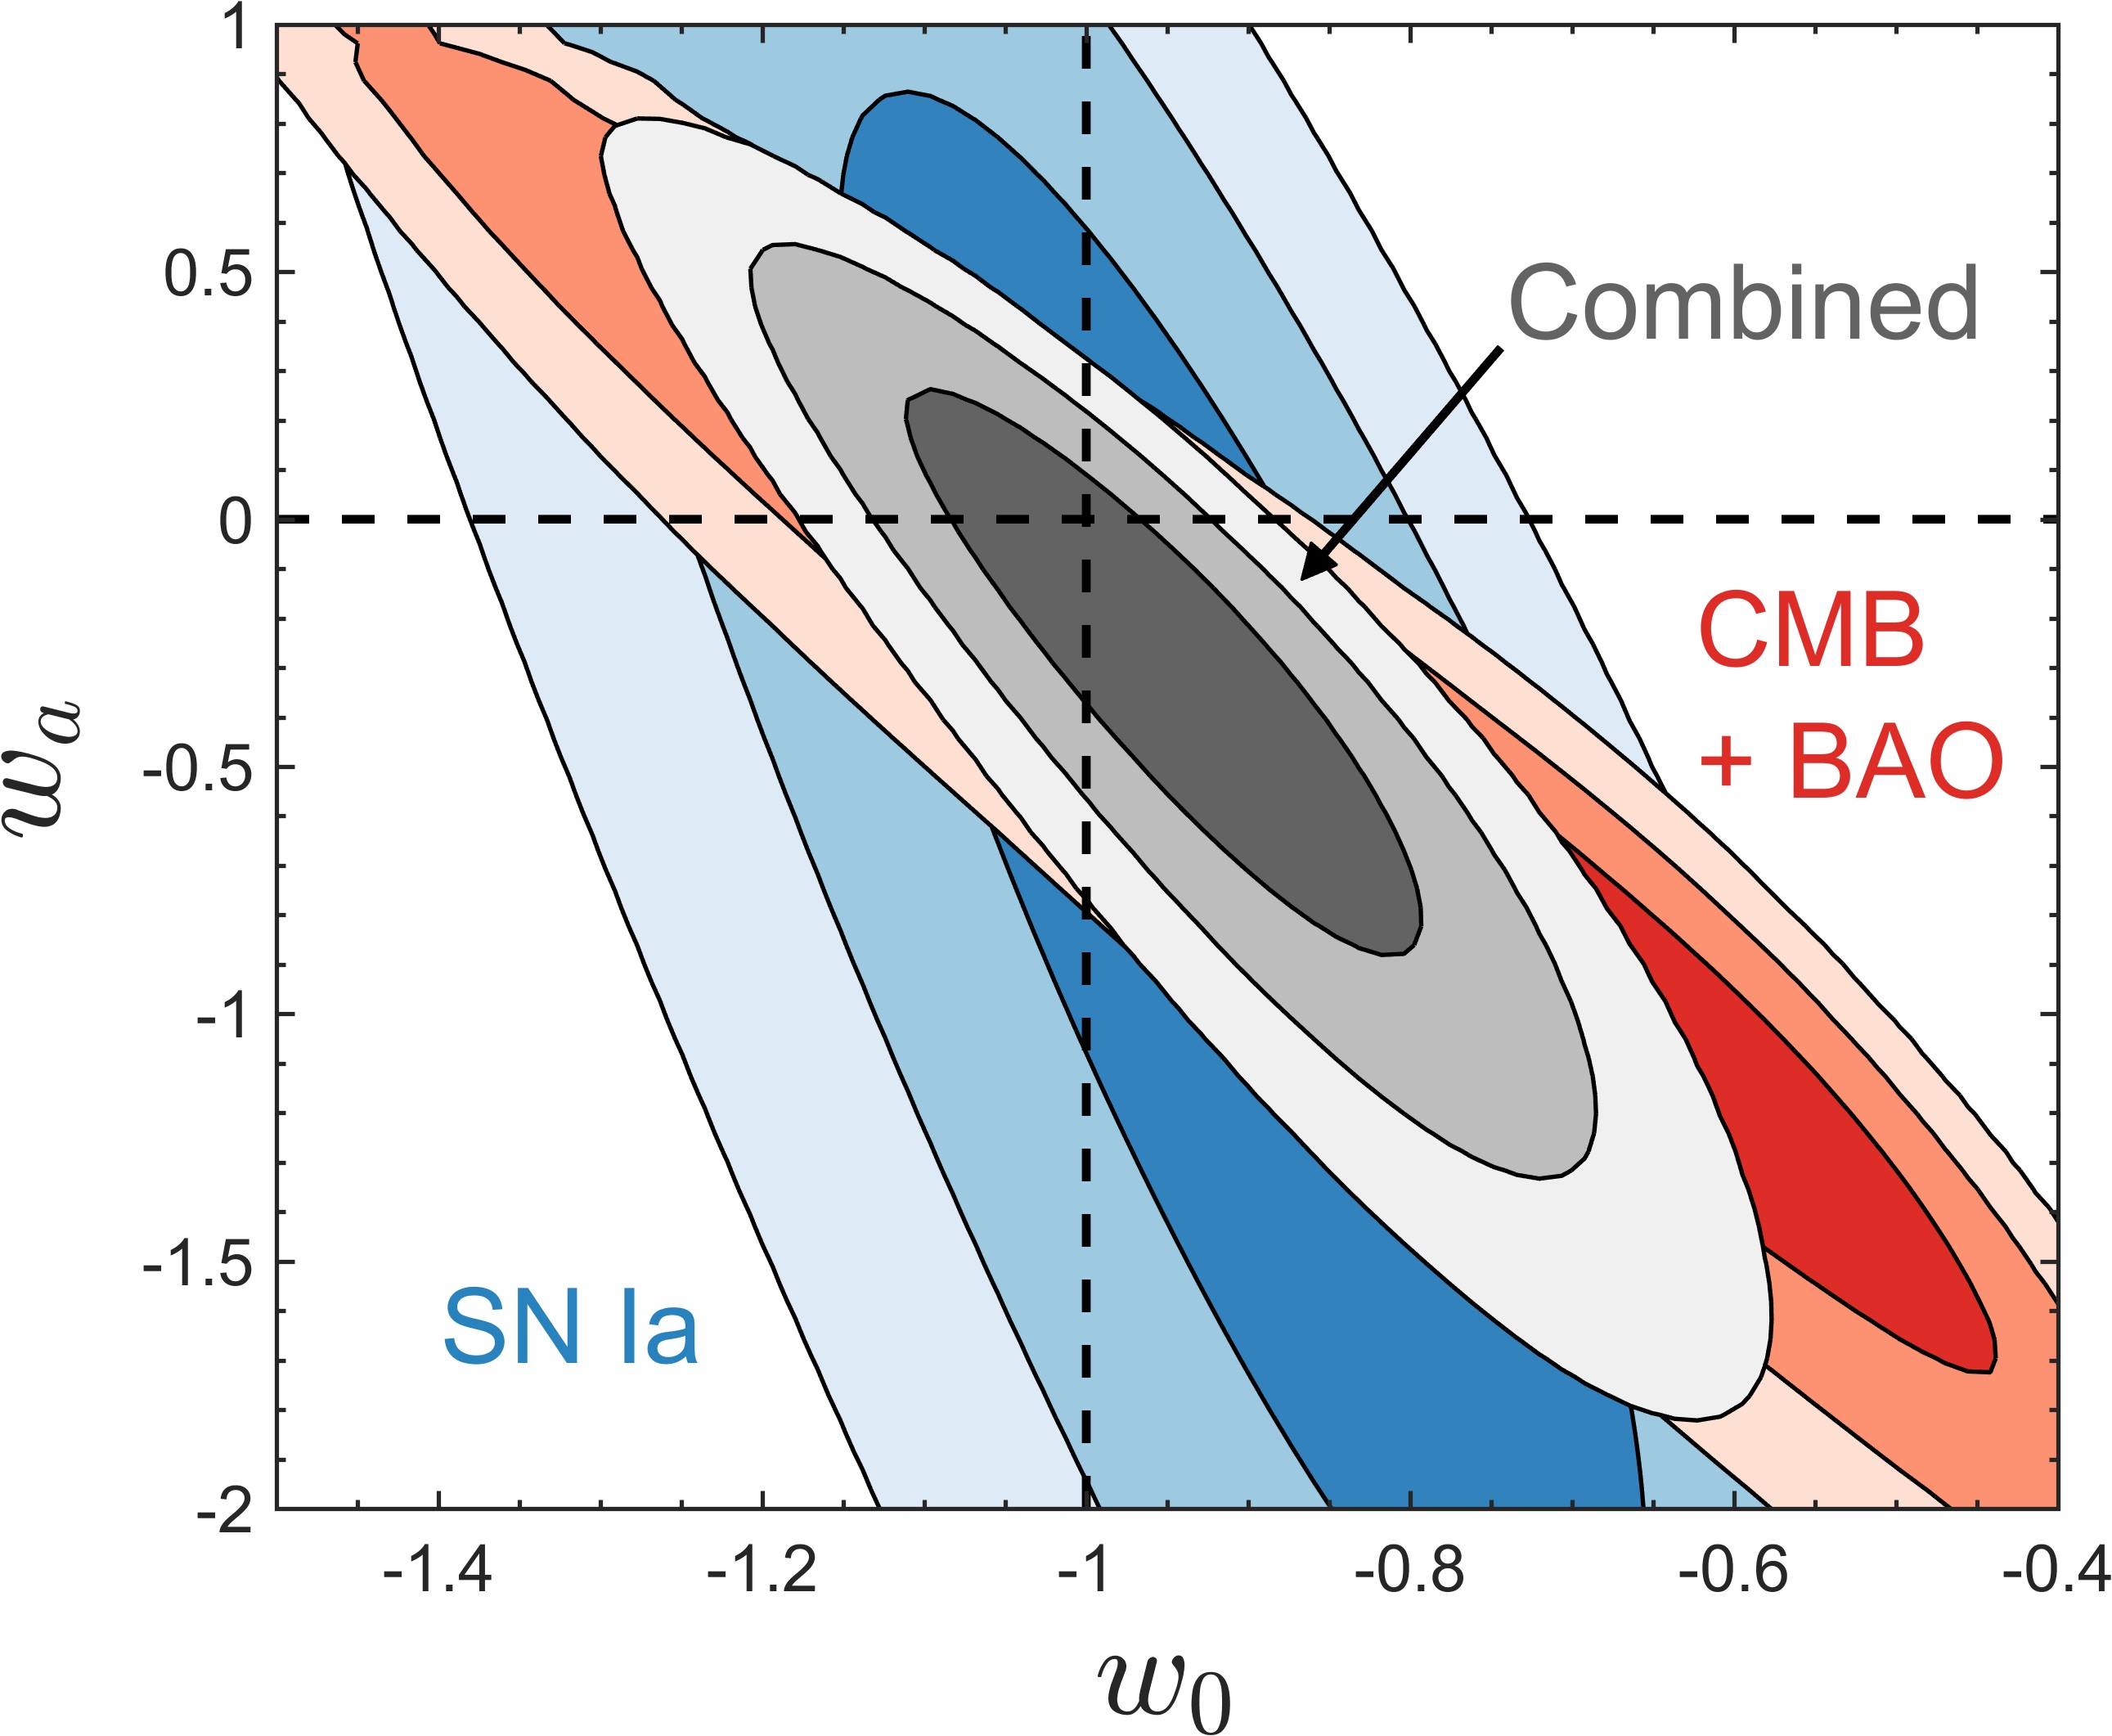
$w_0$-$w_a$ plane, current constraints:

-
File formats:
- jpeg (494 kb)
- png (351 kb)
- pdf (338 kb)
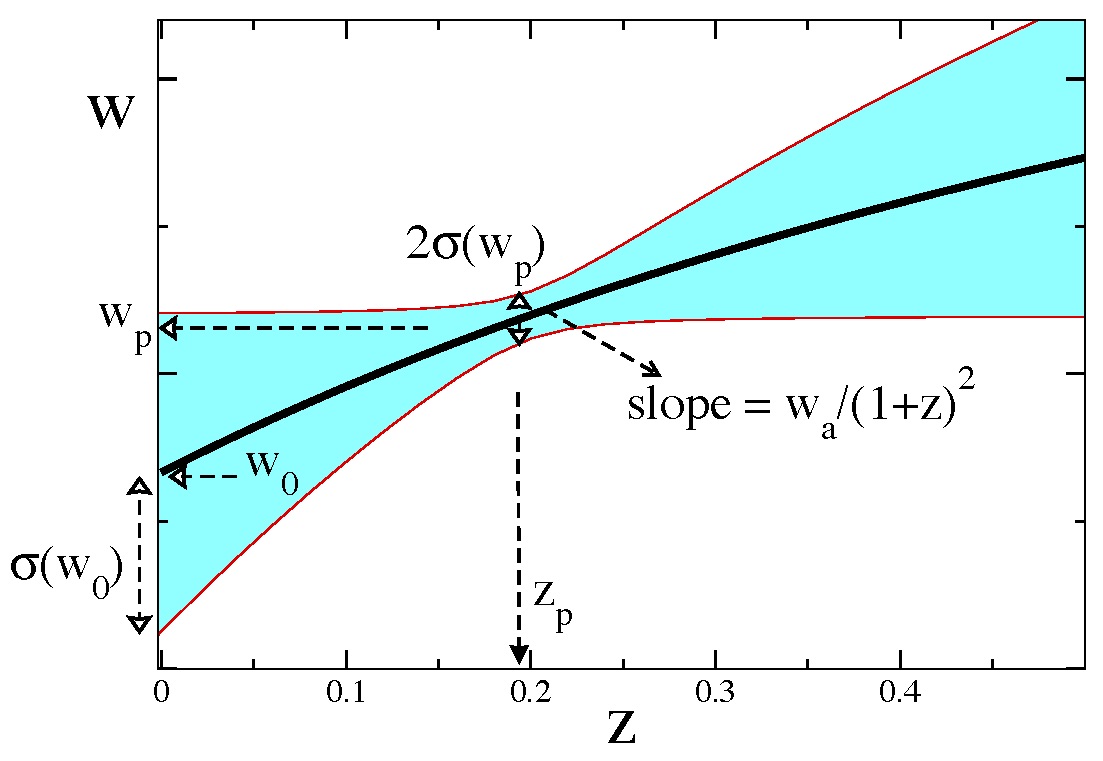
Illustration of the quantities in the $(w_0, w_a)$ parametrization:

-
File formats:
- jpeg (33 kb)
- png (17 kb)
- pdf (98 kb)
Effect of DE on cosmological observables:
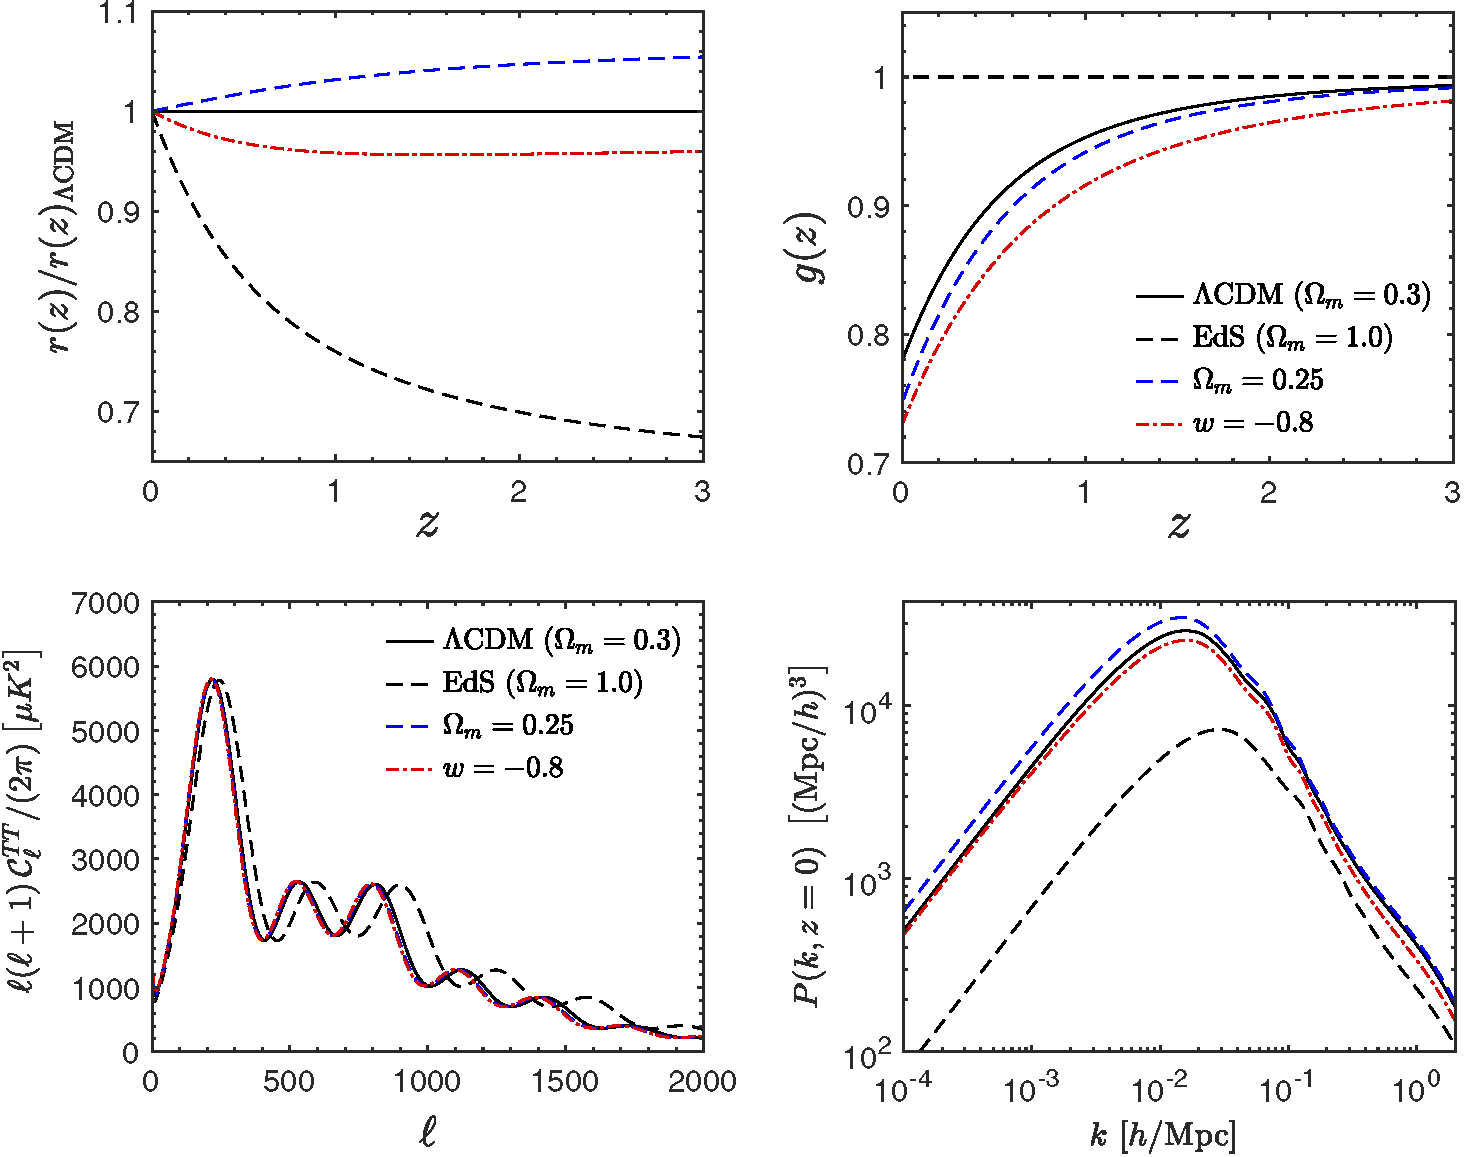
-
File formats:
- jpeg (267 kb)
- png (94 kb)
- pdf (240 kb)
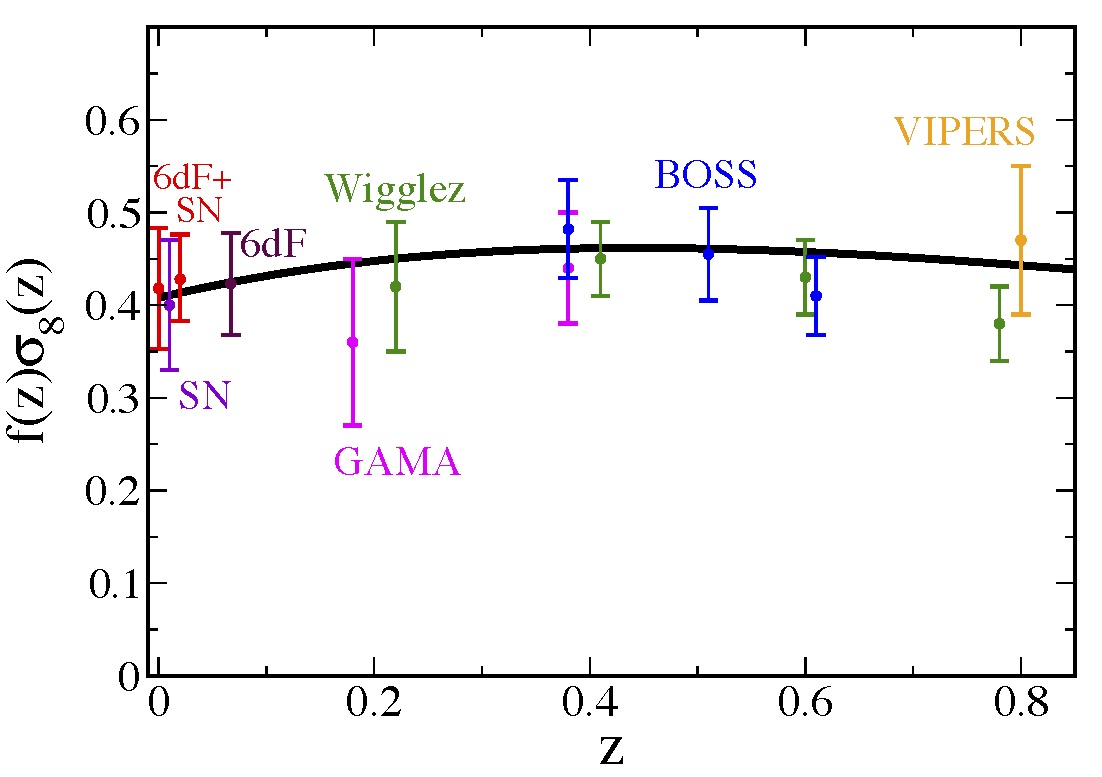
Current constraints in the $f$-$\sigma_8$ plane:
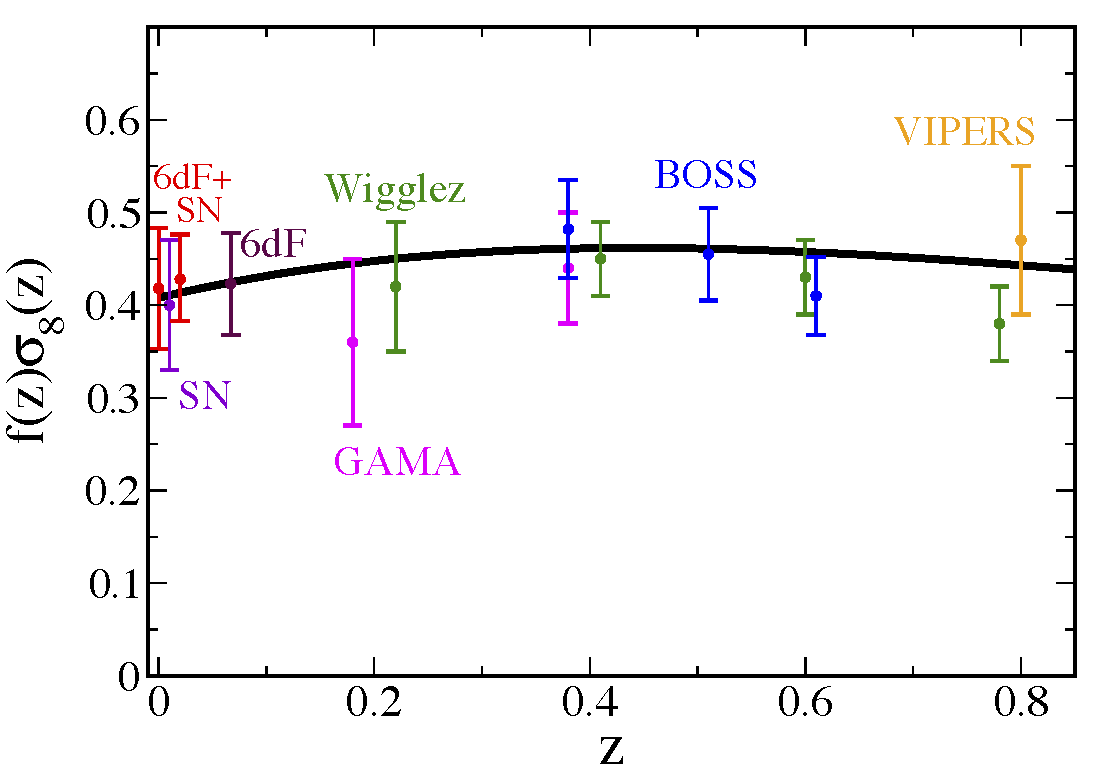
-
File formats:
- jpeg (94 kb)
- png (33 kb)
- pdf (232 kb)
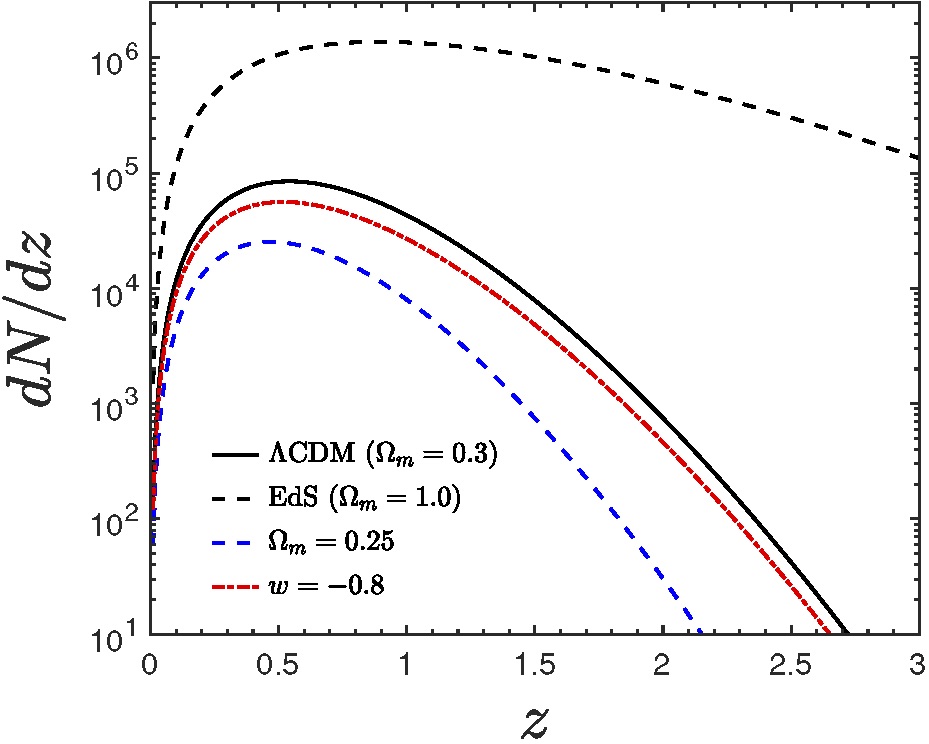
Cluster counts:
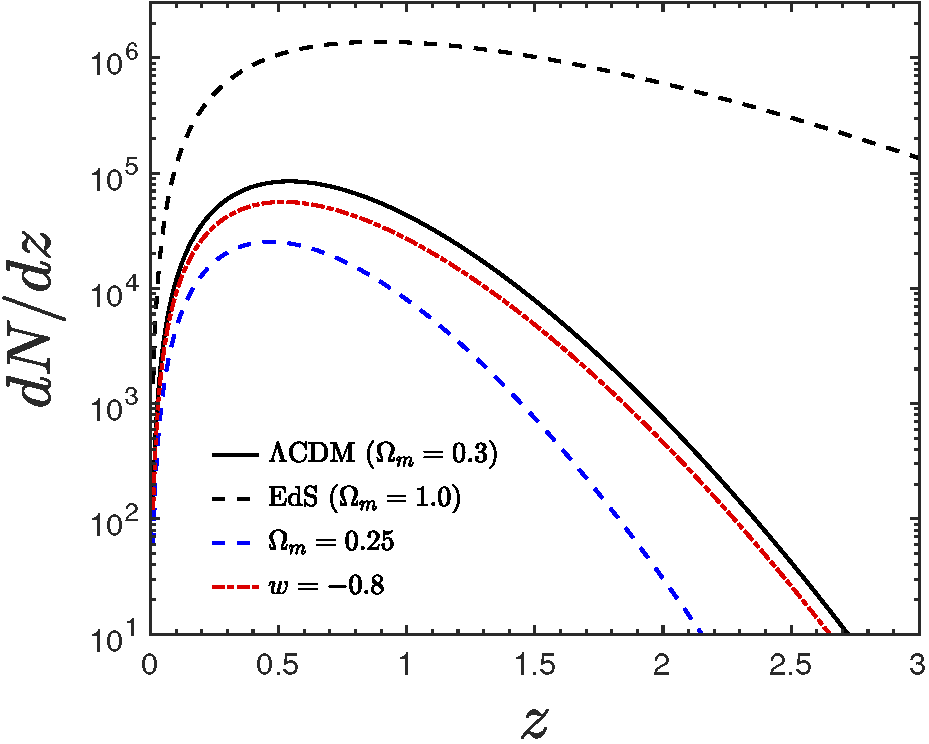
-
File formats:
- jpeg (105 kb)
- png (39 kb)
- pdf (36 kb)