Sherif El-Tawil, PhD, PE
Professor and Associate Chair
Department of Civil & Environmental Engineering | The University of Michigan
Characterization of Catenary Action
One of the key mechanisms thought to assist a damaged structure to reach an alternative equilibrium configuration is catenary action. The term catenary action refers to the ability of beams to resist vertical loads through formation of a catenary-like mechanism. Catenary action implies the development of large enough deformations such that gravity and associated debris impact loads are mainly resisted by the vertical components of axial forces that develop in the beams, i.e. catenary forces. Under such conditions, the beams are unable to resist the applied loads through flexural action alone and seek supplemental resistance through formation of the catenary configuration. The structural system must be ductile enough to allow the new configuration to be achieved while maintaining sufficient integrity to support the developing catenary forces. The objective of this research effort is to study the catenary mechanism, specifically how it forms and evolves under continued loading.
Progressive building collapse is a dynamic process wherein a collapsing system continually seeks alternative load paths in order to survive. Mechanisms that could contribute to the capacity of a system to resist collapse include: a) Catenary action of slab and beams allowing gravity load to span adjacent elements; b) Vierendeel action from the moment frame above a damaged column; and c) Gravity load support provided by nonstructural elements such as partitions and infills. Global collapse occurs if equilibrium of the residual structure cannot be attained through one of the aforementioned mechanisms. Of the 3 mechanisms, catenary action represents the last line of defense against collapse because it is activated only after large deformations have occurred (Figure 1). It is furthermore regarded by many practitioners, researchers and code developers as a mechanism that can be reliably developed.
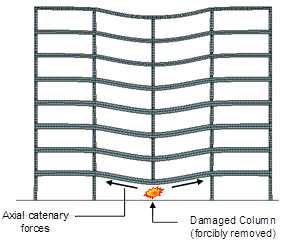
Figure 1: Formation of catenary action in a damaged building.
We have collaborated with researchers at NIST's Building and Fire Research Lab (BFRL) to conduct unique large scale collapse tests on steel subassemblages. The tests are representative of the conditions that occur during collapse, i.e. involving catenary action, and were conducted in full scale. The experiments investigated the response of two types of moment connections, RBS and WUF-B. The test specimen consisted of two beam spans and three columns (Figure 2). The two exterior columns were prevented from moving horizontally while the central column stub was pushed down vertically till failure was occurred. Figure 3 show the physical test setup, while Figure 4 shows the specimen after the test was concluded, where it is clear how far down the specimen was pushed.
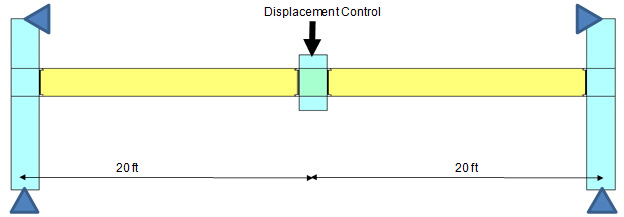
Figure 2: Test setup for RBS specimen tested at NIST.
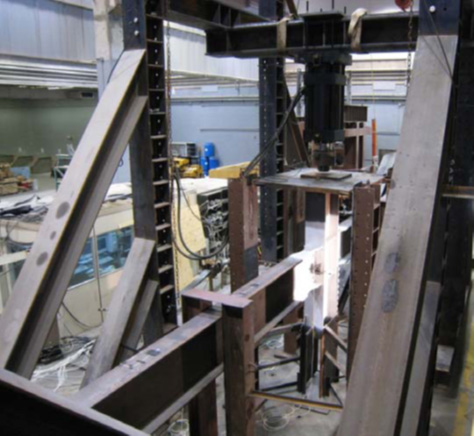
Figure 3: Physical setup for RBS specimen tested at NIST.
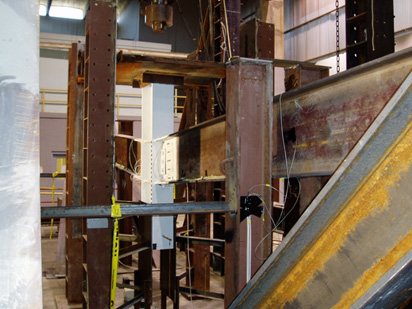
Figure 4: Specimen after the test.
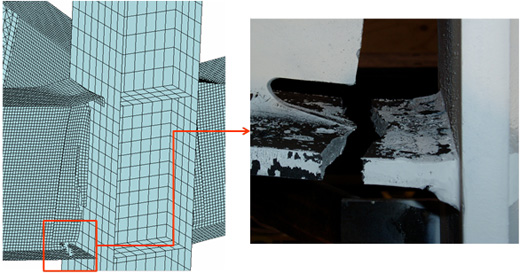
The experimental data was used to validate the computational models developed in other research projects. The subassemblage model was loaded as the specimen was in the test, i.e. by pushing down on the central column. As shown in Figures 5 through 7, both models yielded good results and also matched well in the specifics associated with overall behavior. For example, failure in both models occurred in the small section of the RBS of one of the beams, as occurred in the test. Figure 8 shows a plot between the vertical displacements at the central column versus the applied load for the RBS specimen, as measured experimentally and computed from the two models employed. Clearly, the computed response is in good agreement with the measured one.
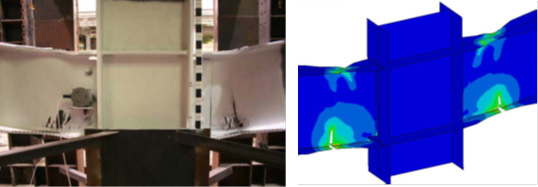
Figure 5: Comparison between experimental and model failure mode for RBS connection.

Figure 6: Zoom in on failure location for RBS connection.
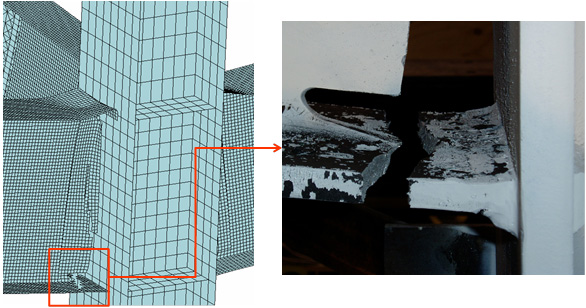
Figure 7: Comparison between experimental and model failure mode for WUF-W connection.
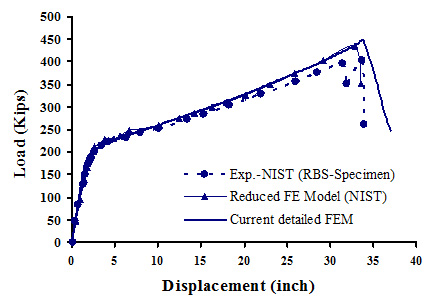
Figure 8: Comparison between measured and computed load versus displacement data for RBS connection.