This is some experimental vizualizations of Sakai data based on the commit logs from June 2005 - November 2008 - this effectively includes the time between Sakai 2.0 and Sakai 2.5.
This data was pulled using screen scraping from viewsvn at the source.sakaiproject.org site. The initial screen scrape took about 20 hours over my cable modem and resulted in about 540MB of data representing 100,000 commits. Then the data was parsed (2 hours) and categorized to produce a nicely normalized database of about 3MB which is much more manageable. Using this database - each extraction / accumulation takes about 20 seconds.
To extract and accumulate the data, I write SQL queries and/or Python
scripts to slice and dice the information.
You can take the data and look at it yourself using SQLite. You can either
use the SQLite3 command line option or the SQLite3 browser.

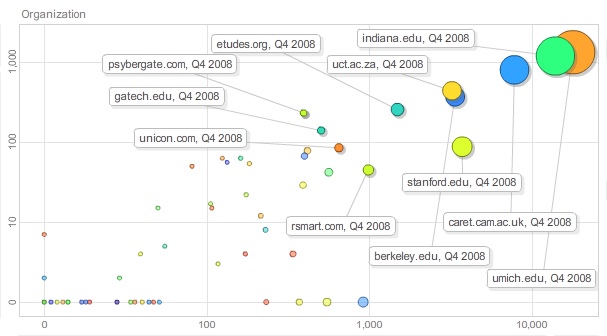
These use Google's Vizualization API.
Feel free to look at the DB and see if there are revisions I have mistakenly characterized as tags or branches or trunk. If you have identify any problems with the data drop a line to Dr. Chuck.