Part II: Interpolation of the Benchmarked Map
Adjunct Professor of Mathematical
Geography and Population-Environment
Dynamics
School of Natural Resources and Environment, The University of
Michigan, Ann Arbor
Please set screen to highest
resolution and use a high speed internet connection.
Please download the most recent free version of Google Earth®. Make sure the "Terrain"
box in Google Earth® is checked.
|
Download
the following file to use in Google Earth®
in addtion to the files from Part I:
|
Christaller's 1941 map
of a plan for the settlement of western and central Poland was brought
into Google Earth® in Part I of this
article. The map was aligned with the globe using a set of
benchmarks on the three highest levels of Christaller's
hierarchy. It remained to fill in the lower levels of the
hierarchy on the Google Earth® globe. The
sequence of images below does so.
The strategy for completing the task employs the use of "placemarks" directly in Google Earth® . Placemarks are symbols that can be assigned location (x-y coordinates) and height. They are displayed in a "billboard" format so they always face the driver in the virtual reality scene. The location assigned to placemarks in Figure 1 are those from the Christaller map. The height given to placemarks is assigned by number of inhabitants from the legend in the Christaller map displayed in Part I: a location to be assigned 30,000 inhabitants is given a placemark anchored to the globe from a height of 30,000 meters. All heights correspond directly to those in the legend of the Christaller map except the height for the largest cities: they are to have 450,000 inhabitants but were given a placemark height of 200,000 meters here to keep the symbol within visual range. In the sequence of images below, the large blue crosses represent cities to have 450,000 inhabitants; the large red crosses those of 100,000; and, the red crosses with yellow outline those of 30,000. These three top categories, corresponding to benchmarked places, also are labelled with target inhabitant population. Below that in the hierarchy, places targeted for 9000 inhabitants are marked with a red cross placemark outlined in white; those targeted for 3000 are marked with a yellow square; those targeted fro 1200 with a magenta square, and those targeted for 600 with an evergreen tree. It is not necessary for the reader to keep all that in mind; the legend at the left in Google Earth® will remind the reader. Click on a category and a yellow box will find a representative of that category in the map. Also, when taking a side-looking approach, the relative heights of the placemarks coupled with the Google Earth® legend will help. Drive around in this landscape using the files downloaded at the top.
 Figure 1. Placemarks interpolate benchmarks on the Google Earth® globe. |
Figure 2 shows a
side-looking view of Figure 1. Notice the different heights of
the placemarks. Figure 3 shows a ground-level view of the same
image. Notice that some of the tree symbols are partially
obscured by variation in terrain.
 Figure 2. Side-looking view of the map in Figure 1. |
 Figure 3. Ground-level view of the image in Figure 1. |
It
was important to have the Christaller map superimposed on the globe in
order to interpolate lower level central places among the
benchmarks. However, once the interpolation is complete, the map
boundaries may interfere with visualising the landscape in relation to
the placemarks. Figure 4 shows the entire set of placemarks with
the map removed. Try recreating this picture using the downloaded
files. Then, zoom in and drive around the virtual reality
landscape.
The benchmarks in Figure 4 may also interfere with a good view of the local landscape. Figure 5 shows a side-looking view of a river valley and placemarks, only. Load the files and recreate this scene. Drive around and look at the fields, towns, and cities of Poland in relation to the placemarks representing Christaller's choices for settlements.
 Figure 4. Animation of placemarks. The Christaller map has been removed. Benchmark rods remain.. |
The benchmarks in Figure 4 may also interfere with a good view of the local landscape. Figure 5 shows a side-looking view of a river valley and placemarks, only. Load the files and recreate this scene. Drive around and look at the fields, towns, and cities of Poland in relation to the placemarks representing Christaller's choices for settlements.
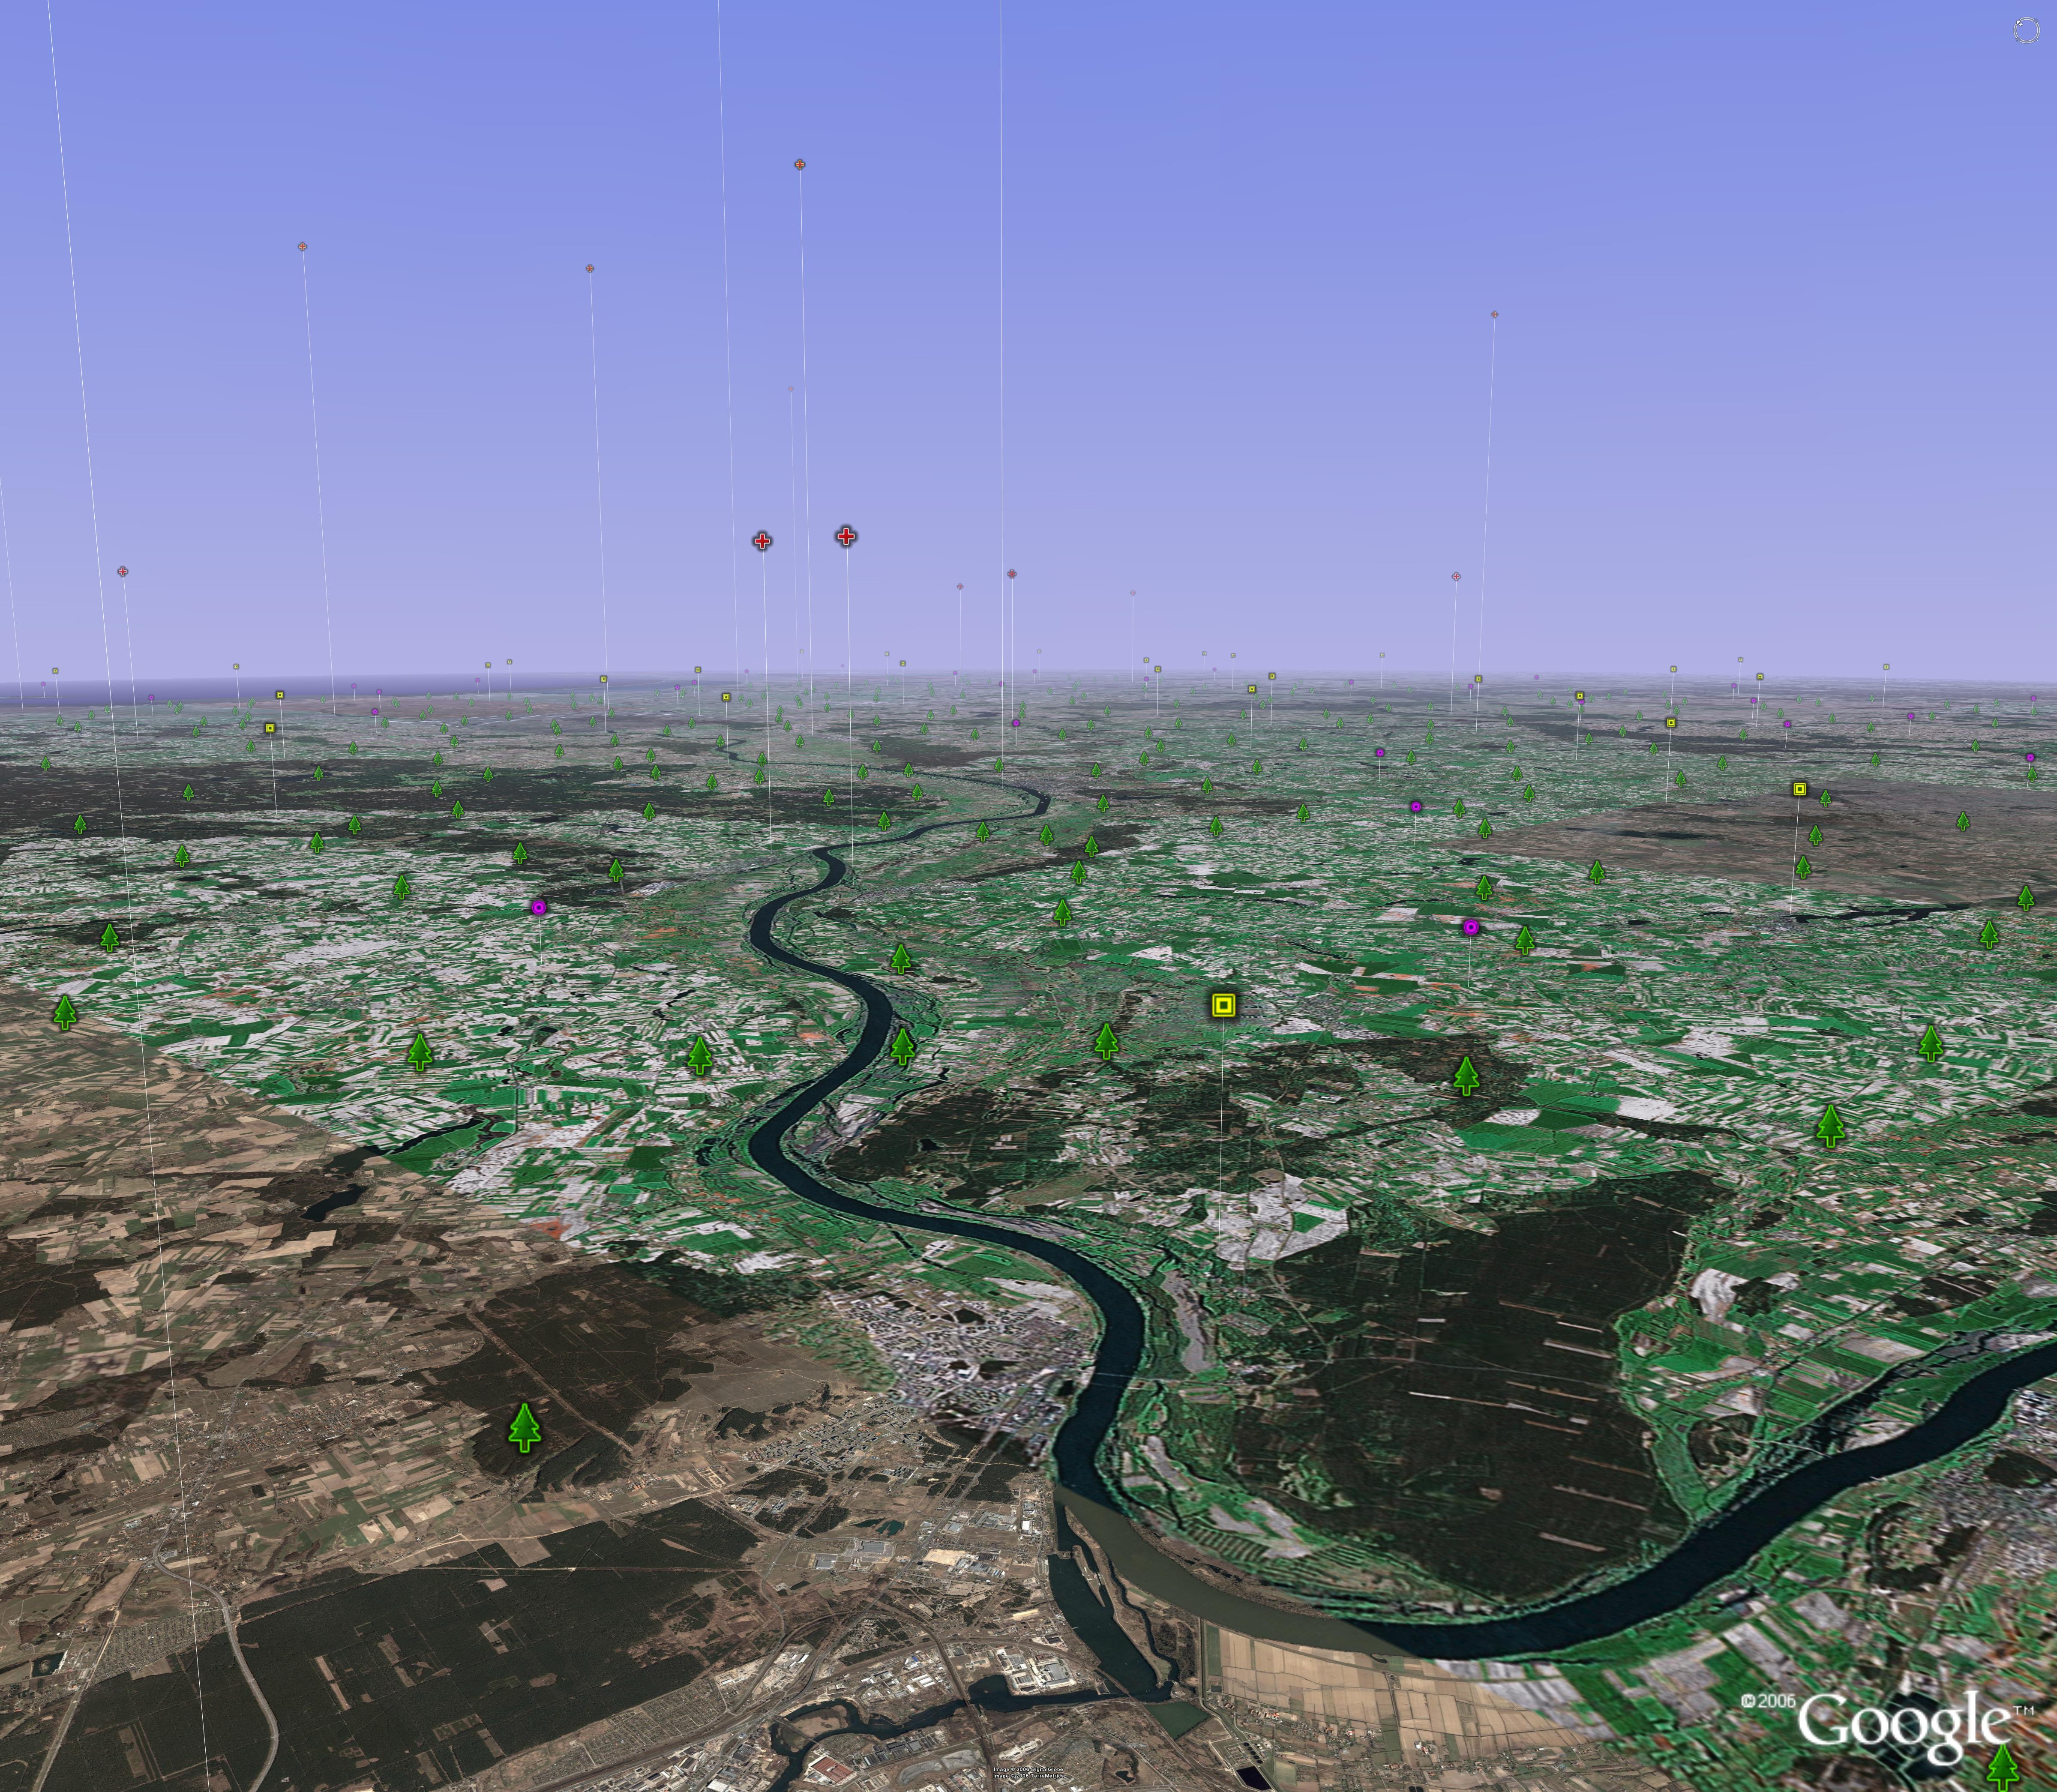 Figure 5. |
FOR
RELATED REFERENCES, PLEASE SEE THE SET AT THE END OF PART I.
Solstice:
An Electronic Journal of Geography and Mathematics, Volume XVII,
Number 2
Institute of Mathematical Geography (IMaGe).
All rights reserved worldwide, by IMaGe and by the authors.
Please contact an appropriate party concerning citation of this article: sarhaus@umich.edu
http://www.imagenet.org
Institute of Mathematical Geography (IMaGe).
All rights reserved worldwide, by IMaGe and by the authors.
Please contact an appropriate party concerning citation of this article: sarhaus@umich.edu
http://www.imagenet.org