Procedure used to date to create a structural building base of
downtown (no detail):
-
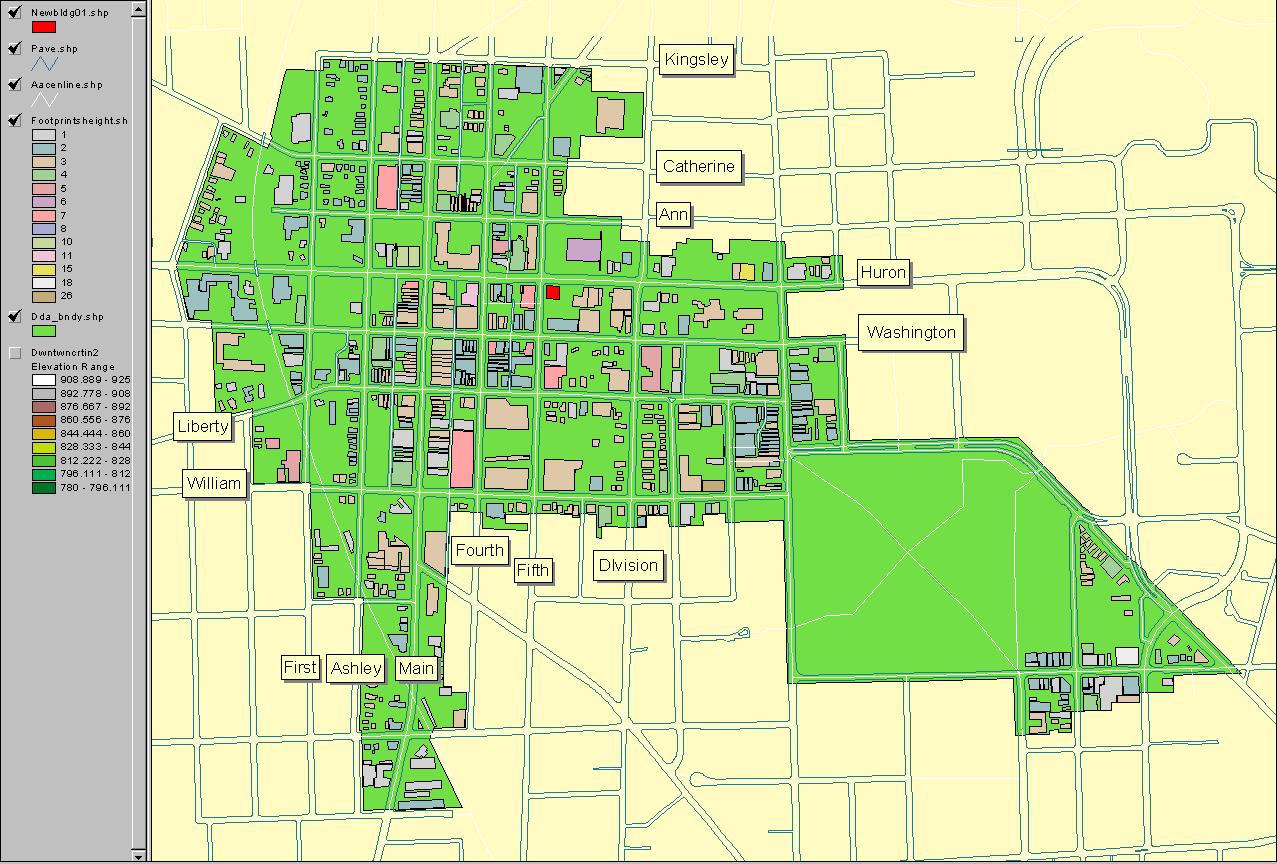
Building footprints were digitized using a city aerial (.tif file).
They are represented in the map above as polygons filled with color according
to building height (all buildings of the same height have the same color).
-
Issues with height:
-
Over 300 polygons had a value of "0" height. For all but 32 of those
polygons, the digitized building footprints were assigned values based
on the FAR for the zoning category. Because the parcel outline generally
exceeded the building footprint in area, this decision likely produces
buildings that are shorter than what is permitted (although of course there
may be actual buildings that have been constructed at less than what is
permitted by right).
-
For the remaining 32 polygons, for which there was no data, a height of
3 stories was inserted.
-
Stories were assumed to be 12.5 feet in height.
-
Contours, with a contour interval of 5 feet, were used to create a triangulated
irregular network (not visible, but in the background) as a topographic
base level from which to measure building height (rather than from a flat
geometric base level).
-
Virtual reality files were created (as .vrml 2.0) with the sun in the southwest
(azimuth 225 degrees) at a "low" noon height of 30 degrees and at a "high"
noon height of 50 degrees. This was done in order to suggest variation
in lighting conditions with season and with time of day.
-
A new building was added in response to comments from Mayor John Hieftje.
-
Earlier of versions of files were shown to the Ordinance Revisions Committee
of City of Ann Arbor Planning Commission.
-
Planning Director Karen Hart and Environmental Coordination Services and
Emergency Management Director Matthew Naud, both of the City of Ann Arbor,
previewed earlier files in the immersion CAVE and on the GeoWall.
|
Current activities:
-
Sandra Arlinghaus and John Nystuen are working on a grant proposal
through Urban Planning to create a 3D Atlas of Ann Arbor to be turned over
to the city so that it might make creative use of 3D capability. (The application
will also involve Beier and the 3D Lab.) The goal is to make virtual
reality files of all city maps that are in electronic form. These
might then be used in a whole host of applications from the "obvious" planning
application above (for a possible maximum height ordinance or simply for
visualization by Council in deciding what ordinance possibilities to pursue)
to training emergency response teams on a city-owned GeoWall to...(you
supply the possibilities). COME SEE THE FILES PLAY OUT AND THINK
OF POSSIBLE APPLICATIONS!
-
Arlinghaus, Naud, and Nystuen are serving as faculty advisors in Peter
Beier's Engineering 477 course on virtual reality this Fall. They
have a team of four students they are working with: Taejung Kwon,
Paul Oppenheim, Adrian Lazzaro, and Aaron Rosenblum.
The students are currently working, using these files as base files, at
creating a pilot study for the proposed Atlas:
-
adding a slider to the new red building so that the viewer of the VR on
the web can adjust building height
-
navigation cues inserted in file
-
adding substantial detail to one block of buildings (on Main Street between
Liberty and Washington) such as texture, trees in their proper places,
street signs, animation, and so forth so that the scene looks like downtown.
-
addition of detail through application of photographic evidence will be
done to mimick the pedestrian view of the streetscape.
|
Questions to think about--please help us to help you--let us
know what you do like and what you would like to have, in addition.
Here are a few items as suggestions (but please feel free to add your own).
Also, what is most important to you--please tell us!
-
Upgrade quality of actual street heights
-
field check building heights
-
get building heights where there were none or only FAR estimates
-
Work at adjusting any possible unit discrepancies between ArcView (feet)
and vrml (meters).
-
Adjust lighting by calculating elevation of sun in the sky using latitude
of the centroid of the DDA (with latitude read from a GPS, possibly).
-
Thinning of file size based on scale.
-
Produce a number of other files based on various lighting possibilities.
-
Introduce cars along the streets.
-
Introduce pedestrians on the sidewalks.
-
Model the weather (snow storm...).
-
Work at getting the detailed file into the immersion CAVE (in vrml 1.0)
for viewing by a broader audience.
-
Suggest types of detail you would like
-
Suggest types of applications you think would fit well with this technology
-
Suggest how you think decision-making might be aided. Might VR files serve
to replace the model consideration in the PUD zoning? If so, what
sort of ordinance revision would be necessary and what legal ramifications
might there be in such a consideration or in related ones?
-
Anything else that crosses your mind in response to looking at the VR.
|