 |
1. Easiest.
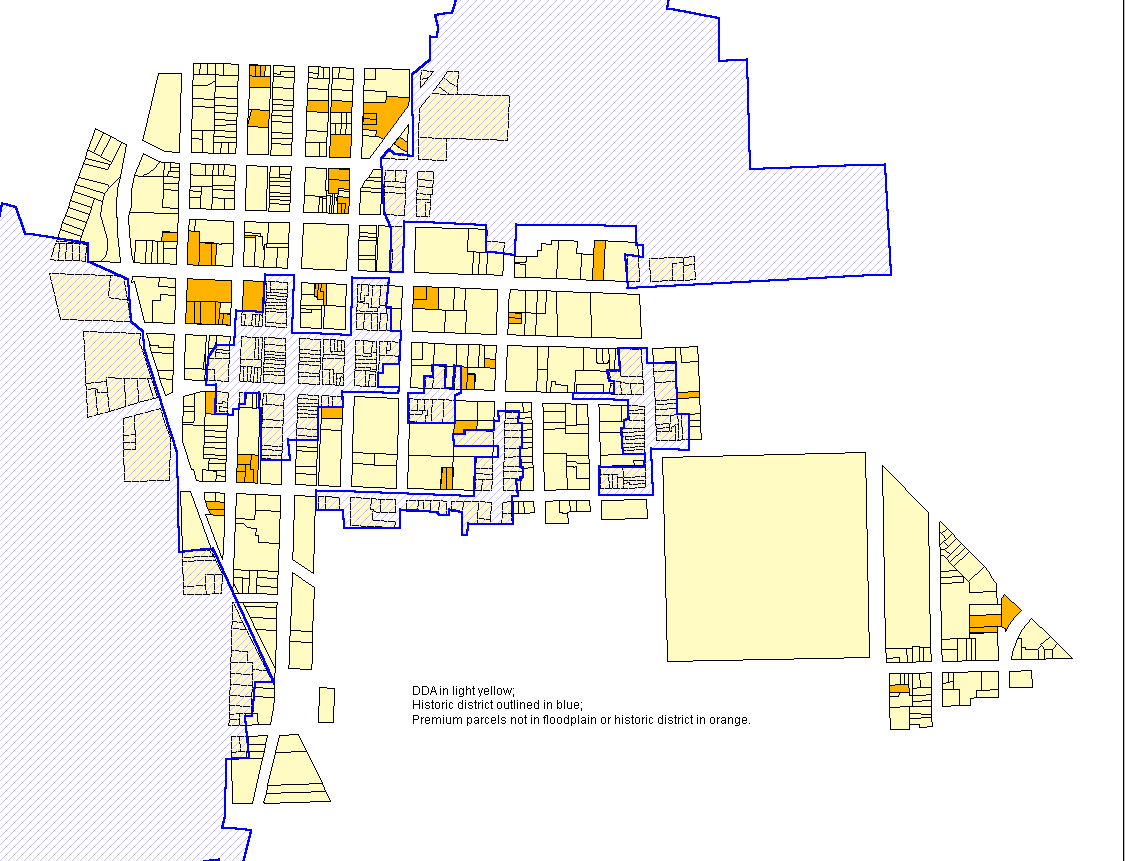
Suppose you wish to designate various
targets of opportunity--say from among the premium parcels found in the
analysis on the previous page--those parcels in the DDA that are already
zoned to support premiums and that also do not lie in the floodplain or
the historic districts. If you also wish to restrict height on parcels
within some distance of the historic districts, for example, this calculation
is easy to make. The two dimensional result is shown below, using
a distance of 50 feet (with some rationale attached, such as sum of two
street widths of 26 and 24 feet, or whatever).
|
This sort of partitioning of parcels, based on policy, is very easy to do. The reason it is easy is that the parcel boundaries are already digitized at a level that is satisfactory for official use.
WHAT MIGHT BE MOST USEFUL, to the modeling effort HERE,
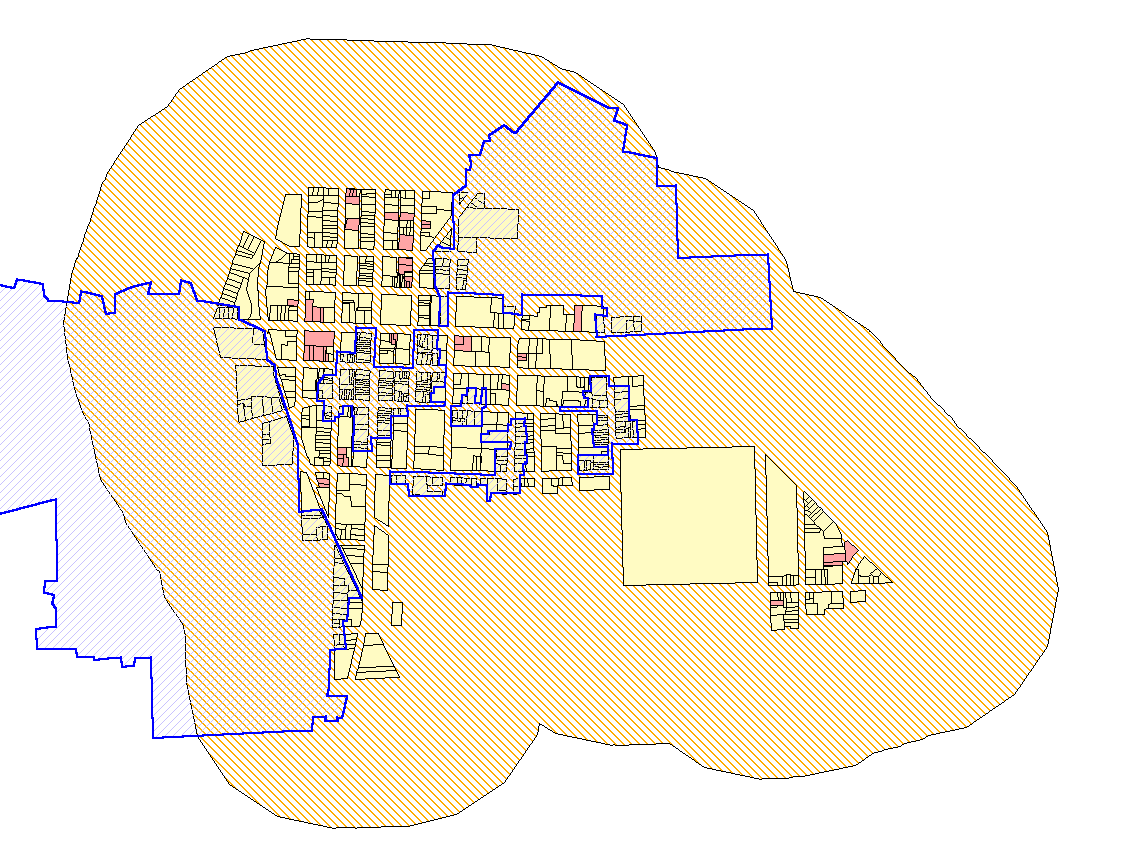
Another example of just sorting existing
layers in various ways might come from looking at the DDA buffer zone of
1/4 mile (distance one might reasonably be expected to walk to a bus stop--or
a DDA-perimeter bus stop). It's easy to pick out the vacant parcels,
from the set supplied by planning, that lie in the buffer and do not lie
within the DDA or within historic districts (other conditions would be
easy to add on or alter)--these parcels are shown in gold, below.
It's also easy to select, from this latter set, only those parcels that
are more than 1/3 acre in size (shown in red below)--or whatever existing
conditions tell us what is, and what is not, a buildable lot (shape, size,
adjacency to zoning types of various sorts, or whatever--then it is easy
to exclude those parcels if the data is there, once decisions are made).
The animation below shows first, all vacant parcels that lie within the
1/4 mile buffer zone (orange stripes), outside the DDA (regulatory mechanisms
differ within and outside the DDA); then, all parcels of the latter sort
that do not lie within existing historic districts; then all parcels of
the latter sort that are more than 1/3 acre.
Here is a link
to a VR model including all red parcels, both within the DDA, as red parcels
below, and in the 1/4 mile buffer, as below, extruded (entire parcel) at
the level of six stories). It also includes the footprints file extruded
according to actual height.
 |
WHAT MIGHT BE MOST USEFUL, to the modeling effort HERE,
2. Next.
Extrude the parcel set from above and
create a VR model. What is required to extrude, in addition to having
the right software, is to add new columns to the parcel database that reflect
new decisions on heights.
3. Then next.
Make animations from the VR models--requires
adjusting the code underlying the VR model and setting viewpoints to be
consistent throughout a sequence of VR models. Once code is adjusted,
then go in to each VR model to the appropriate viewpoint, do a screen capture,
and assemble the sequence of screen captures and set timing as desired
between successive animation frames. Introduce "tweening" if desired
to gradually fade from one frame to the next.
4. Most time consuming.
Digitizing of building footprints.
Thus, issues involving setbacks are the most time consuming. There
are ways to make this quicker, if the footprint size is viewed as a percentage
of parcel size. For example, at footprint size = 100 percent of parcel
size, a building of 6 stories might be built by right on one parcel if
its FAR were 600%; if the building footprint is reduced to 50% of the parcel
area, then a building of 12 stories might be built by right using the 600%
FAR; if the building footprint were 75% of parcel area, or 3/4, then a
building of 4/3 height, or 8 stories (6 + one-third of 6)=(6+2)=8--hence
the rectangular hyperbola of a previous link) might be built by right using
the 600% FAR.
So, it's not too time-consuming to digitize part of a lot and make the resulting area approximately half or three quarters of the parcel area. It's a lot more time-consuming to specify exactly where the building can be placed in that 50% (or whatever) through specifying setbacks. On the other hand, it may be that it is well worth expending that time, in terms of making decisions defensible. Just explaining it so the tradeoffs in timing are displayed.
Shadows might be digitized--most desirable would be to have the software create them in response to changing lighting conditions (which can be set by position of sun in the sky--height, as a function of latitude, and direction, by cardinal point on a compass).
Incorporating UM information is of unknown difficulty...need to see files first.
Greater input from the Taskforce provides
greater information from the modeling.
Sandra Arlinghaus