Total estimated square footage within model of
existing buildings: 7,469,852 square feet. |
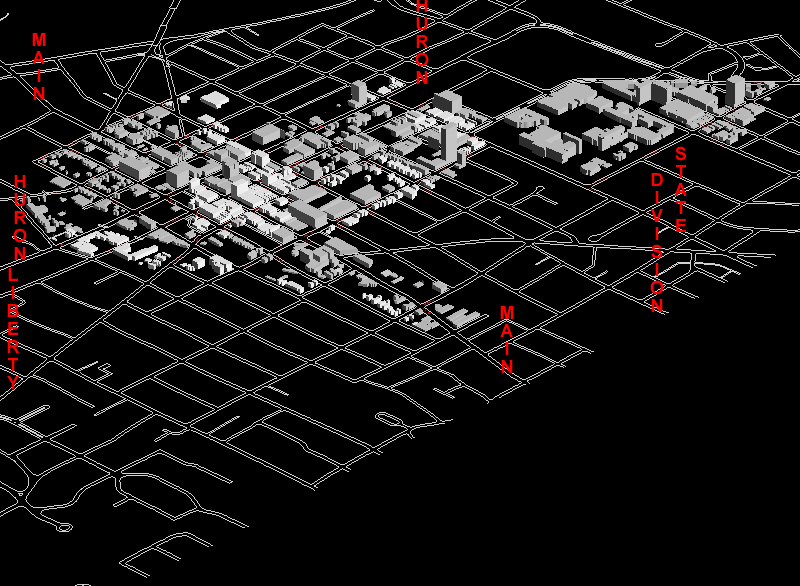
SPATIAL PATTERN DRIVES ZONING.
Model on the left shows existing buildings in the
DDA. Key streets are marked with vertical labels; the last letter
in the street name rests on the appropriate street. The color models
highlight new buildings against the gray, existing model. The all-gray
versions of the color models allow the viewer to consider the entire proposed
downtown and to visualize massing patterns of the new buildings with the
old. The model in this row has the widest variety in height (most
3D texture), much square footage coming from construction proposed for
already-vacant lands, and lowest height changes in existing residential
sections of the DDA (along First and Ashley). Zoning will be adjusted
to fit with buildout. Massing and 3D spatial pattern drive zoning.
The four scenes to the right are based on one
set of ideas:
-
Yellow buildings are built on lots that are now vacant
or that now contain surface parking. All yellow construction represents
new square footage.
-
Towers:
-
are built on 90 by 90 foot bases at heights of 9,
12, and 15 stories. Placement--taller placed at lower elevation within
parameters for spacing between towers.
-
project upward from 3 story decks.
-
Other yellow buildings on parcels not large enough
to hold a tower have 10 foot side setbacks, 0 foot front setbacks, and
40 foot rear setbacks. They have 20 foot upper story setbacks above
the third floor.
-
Blue buildings are built along Huron Street, at mixed
heights of 9, 12, and 15 stories. The placement pattern is arbitrary.
New square footage is determined by subtracting existing square footage
on the target parcels from the modeled square footage. Setbacks are
as above, with the guiding principle that a grand boulevard has uniform
front setbacks and that existing patterns of front setbacks determine that
uniformity locally. Thus,
-
Buildings to the east of Division have 20 foot front
setbacks
-
Buildings to the west of Division have 0 foot front
setbacks and 20 foot upper story setbacks above the third story.
-
Red buildings are built along
-
Liberty, with setbacks as above including 20 foot
upper story setbacks above the third floor. Maximum height is 8 stories
-
First and Ashley, with setbacks as above including
20 foot upper story setbacks above the third floor. Maximum heights:
half at six stories, half at four stories.
-
South Main, with setbacks as above including 20 foot
upper story setbacks above the third floor. Maximum height is as
currently zoned.
-
Not in these views, but in the linked
view: North Main, outside the DDA, east of N. Main. River-view
apartments, set back at 20 feet from N. Main with building footprint scaled
by the golden ratio within the parcel. All square footage in this
category is also considered new square footage.
-
Total available new square footage using these principles
is: yellow, 3,149,919; blue, 1,930,283; red DDA, 2,260,922; red North
Main, 1,674,625. These values add to: 10,690,374. The scenes
to the right choose about half the buildings from each category to approximate
5,000,000 new square feet.
aaaaaaaaaaaaaaaaaaaaaaaaaaaaaaaaaaaaaaaaaaaaaaaaaaaaaaaaaaaaaaaaaaaaaaaaaaaaaaaaaaaaaaaaaaaaaaaaaaaaaaaaaaaaaaaaaaaaaaa |
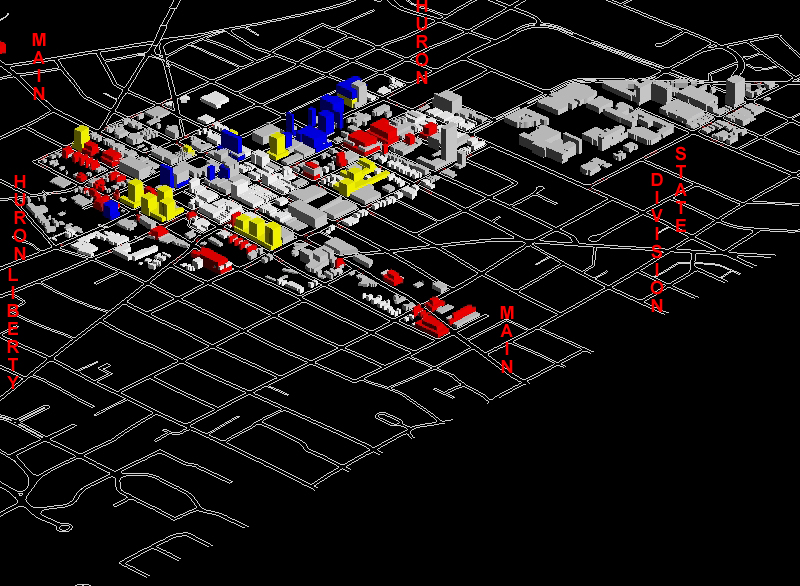
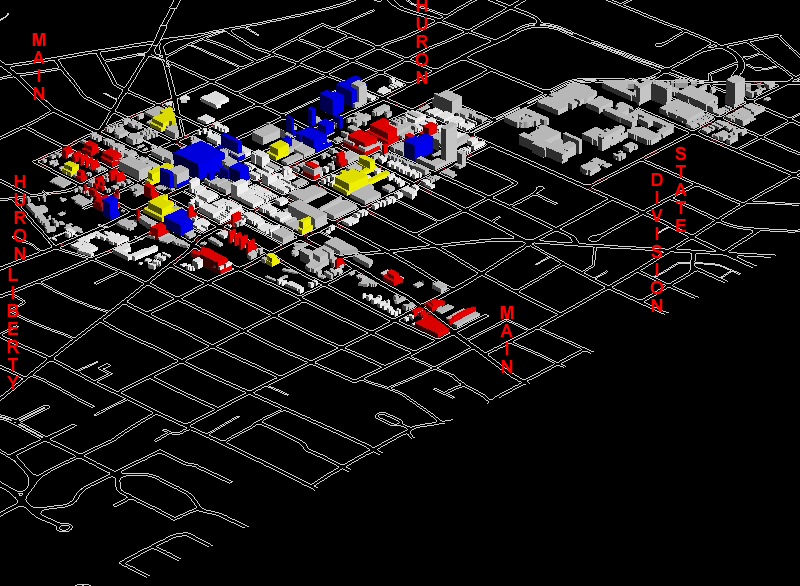
Alternative 1--color. Total estimated
square footage within this model is about 5 million square feet of new
space with most coming from the yellow buildings (about half of 3+ million
in the yellow and about half of 2- in the blue). Model uses widely-spaced
tall buildings to keep increases in height along First and Ashley quite
modest. About one half million new square feet come from North Main
(out of this picture). This model has the widest variety in height
(most 3D texture) and lowest height changes in existing residential
sections of the DDA. |
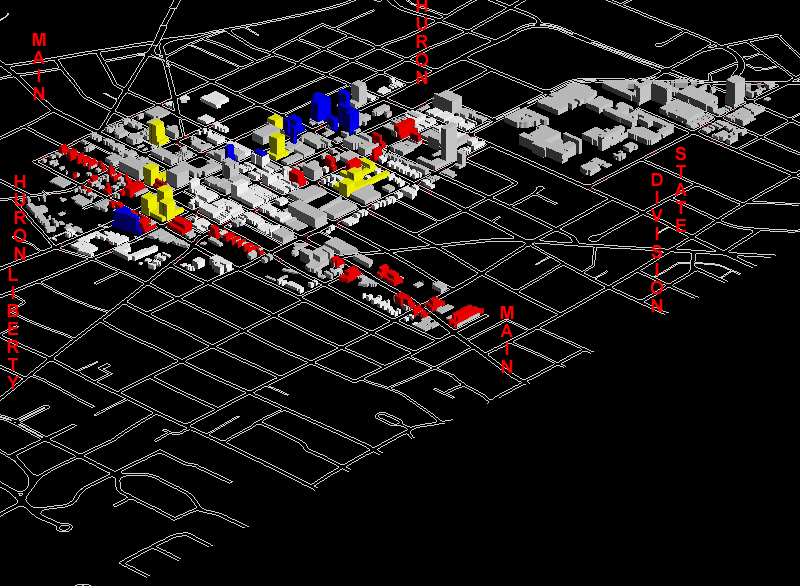
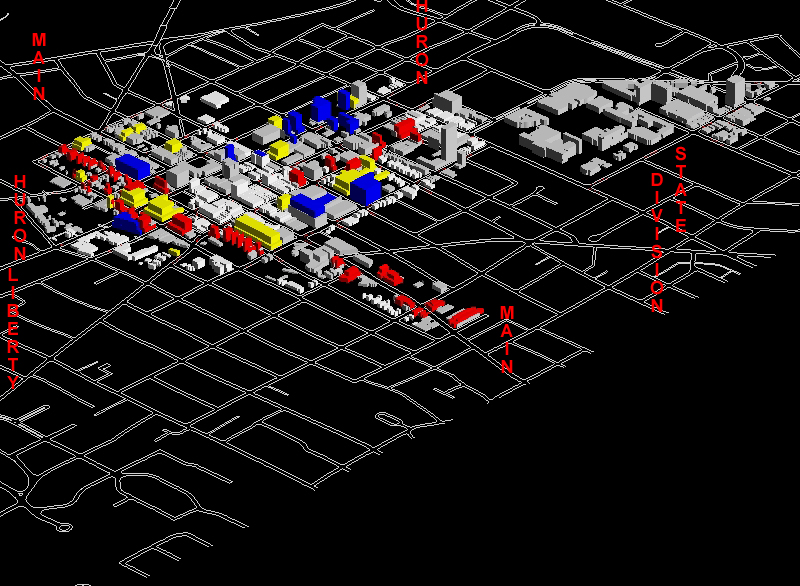
Alternative 2--color. Total
estimated square footage within this model is about 5 million square feet
of new space with most coming from the yellow buildings (about half of
3+ million in the yellow and about half of 2- in the blue). Model
uses widely-spaced tall buildings to keep increases in height along First
and Ashley quite modest. About one half million new square feet come
from North Main (out of this picture). This model has the widest
variety in height (most 3D texture) and lowest height changes in existing
residential sections of the DDA. |

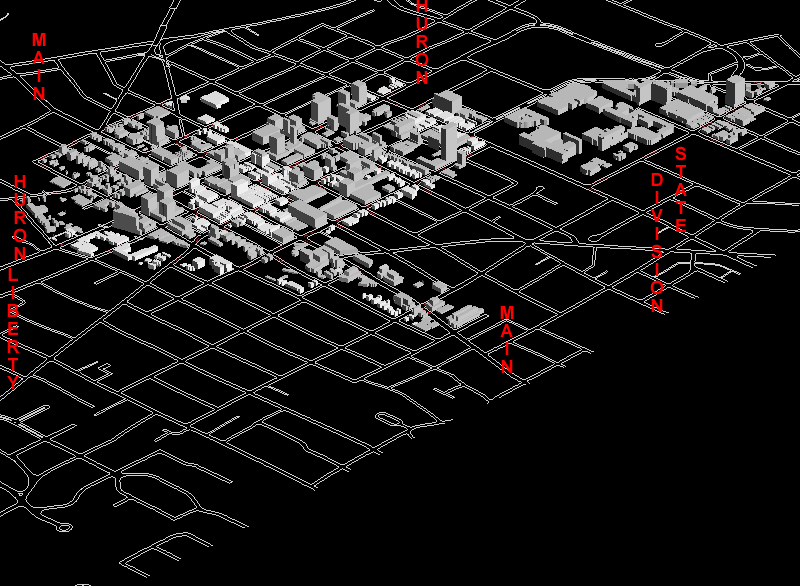
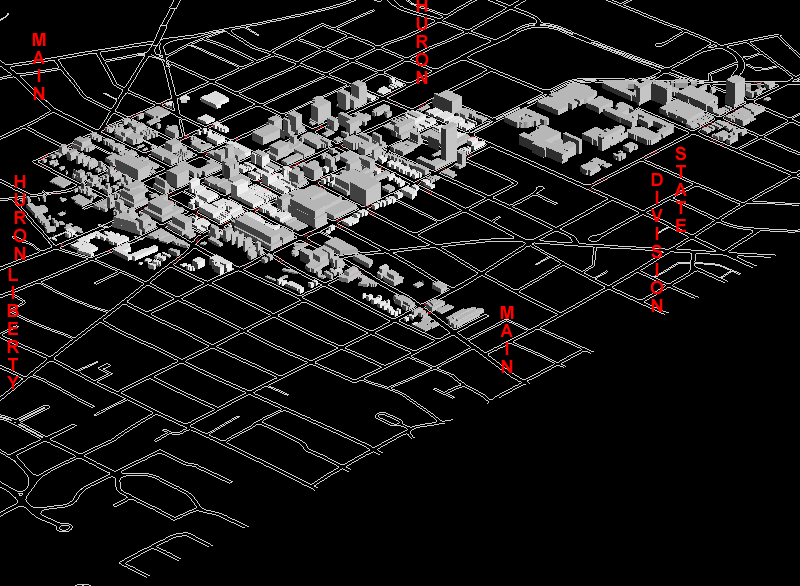
Alternative 1--gray. Model uses
widely-spaced tall buildings to keep increases in height along First and
Ashley quite modest. About one half million new square feet come
from North Main (out of this picture). This model has the widest
variety in height (most 3D texture) and lowest height changes in existing
residential sections of the DDA. |
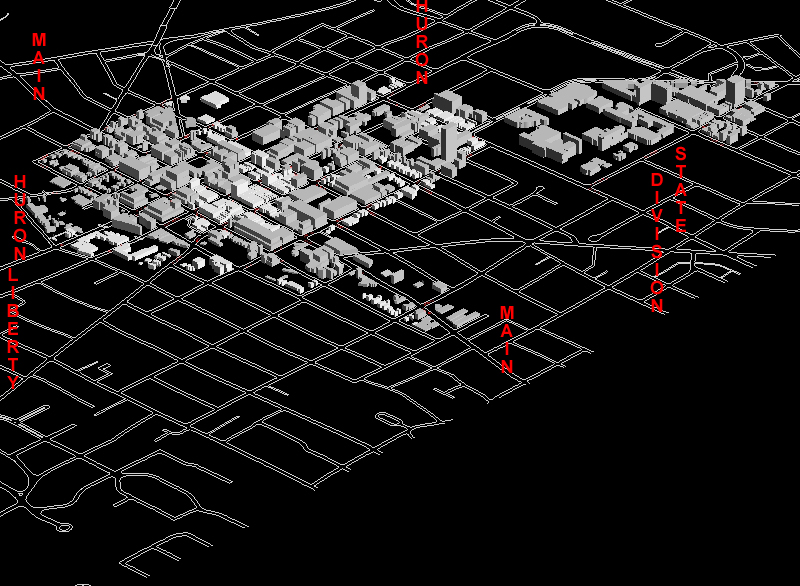
Alternative 2--gray. Model uses
widely-spaced tall buildings to keep increases in height along First and
Ashley quite modest. About one half million new square feet come
from North Main (out of this picture). This model has the widest
variety in height (most 3D texture) and lowest height changes in existing
residential sections of the DDA. |
Total estimated square footage within model of
existing buildings: 7,469,852 square feet. |
ZONING DRIVES SPATIAL PATTERN
Model on the left shows existing buildings in the
DDA. Key streets are marked with vertical labels; the last letter
in the street name rests on the appropriate street. The color models
highlight new buildings against the gray, existing model. The all-gray
versions of the color models allow the viewer to consider the entire proposed
downtown and to visualize massing patterns of the new buildings with the
old. The model in this row has much square footage coming from construction
proposed for already-vacant lands, the widest variety in land use category
included as an option, and the largest total amount of square footage that
could come into the system. It is based on a new zoning plan conceived
in advance of building models. Link
to detailed document involving zoning. One category to note is an
"Opportunity Zone" bounded by William and Huron, State and First, roughly.
Zoning drives spatial pattern.
The four scenes to the right are based on interpreting
the linked zoning document in terms of the categories above, in an effort
to create comparable models. Within that zoning context, the color
categories translate as follows.
-
Yellow buildings are built on lots that are now vacant
or that now contain surface parking. All yellow construction represents
new square footage. The same setbacks are used for these buildings are
are used in the model set above, including 20 foot upper story setbacks
above the third floor.
-
Blue buildings are built
-
along Huron Street at a maximum height of 8 stories
on the south side and 12 stories on the north side (to let sunlight into
the corridor). These buildings are part of a new "Tall" zone that
is split into two sections. See the linked document for detail.
-
Buildings to the east of Division have 20 foot front
setbacks
-
Buildings to the west of Division have 0 foot front
setbacks and 20 foot upper story setbacks above the third story.
-
in parcels
-
within the Opportunity Zone that are currently zoned
Parking or Public Land (not UM) at a maximum of 12 stories east of Main
and 8 stories west of Main.
-
outside the Opportunity Zone at nearby zoning.
-
Red buildings are built along
-
Liberty, with setbacks as above including 20 foot
upper story setbacks above the third floor. Maximum height is 8 stories
-
First and Ashley, with setbacks as above including
20 foot upper story setbacks above the third floor. Maximum heights:
at eight stories in the Opportunity Zone and elsewhere as per zoning prescribed
by new zoning (never more than 8).
-
South Main, with setbacks as above including 20 foot
upper story setbacks above the third floor. Maximum height is as
zoned.
Total available new square footage using these principles
is: yellow, 3,260,010; Huron blue, 1,661,403; red DDA, 2,791,216;
blue P and PL, 4,979,213. The sum of all categories except the P
and Pl value is 7,712,629 square feet; take also 2,287,31 from the 4,979,213
in P and PL to add to 10,000,000. The scenes to the right choose
about half the buildings from each category except P and PL. From
the latter category they show about one-quarter of those. Altogether,
these models roughly approximate 5,000,000 new square feet.
|
Alternative 1--color. Total estimated
square footage within this model is about 5 million square feet of new
space with most coming from the yellow buildings (about half of 3+ million
in the yellow and about half of 2- in the blue). Buildings containing
large amounts of square footage often are more massive, laterally, in appearance
than are those above (which gain mass through height rather than breadth). |
Alternative 2--color.
Total estimated square footage within this model is about 5 million square
feet of new space with most coming from the yellow buildings (about half
of 3+ million in the yellow and about half of 2- in the blue). Buildings
containing large amounts of square footage often are more massive, laterally,
in appearance than are those above (which gain mass through height rather
than breadth). |

Alternative 1--gray. Total estimated
square footage within this model is about 5 million square feet of new
space with most coming from the yellow buildings (about half of 3+ million
in the yellow and about half of 2- in the blue). Buildings containing
large amounts of square footage often are more massive, laterally, in appearance
than are those above (which gain mass through height rather than breadth). |
Alternative 2--gray. Total estimated
square footage within this model is about 5 million square feet of new
space with most coming from the yellow buildings (about half of 3+ million
in the yellow and about half of 2- in the blue). Buildings containing
large amounts of square footage often are more massive, laterally, in appearance
than are those above (which gain mass through height rather than breadth). |
Total estimated square footage within model of
existing buildings: 7,469,852 square feet. |
CURRENT ZONING AND SPATIAL PATTERN:
FULL BUILDOUT
Model on the left shows existing buildings in the
DDA. Key streets are marked with vertical labels; the last letter
in the street name rests on the appropriate street. The color models
highlight new buildings against the gray, existing model. The all-gray
versions of the color models allow the viewer to consider the entire proposed
downtown and to visualize massing patterns of the new buildings with the
old. The model in this row is based on the current zoning and the
current spatial pattern.
These two alternatives show a mixture of construction
categories with yellow buildings on vacant and surface parking lots, as
above, and blue buildings along Huron Street, as above. In both cases,
height is governed by current zoning with premiums (in five zoning categories).
The yellow and blue represent total buildout in those categories.
The red is about 2/3 builtout in those categories allowing premiums.
Many more parcels must see substantial change in order to achieve the 5,000,000
mark. Full buildout is never a reality.
Uniformity in spatial pattern is strong; 3D texture
is weakest in this row of models. Total available new square footage
using these principles is: yellow, 2,375,123; blue, 769,473; red,
2,909720. |

Alternative 1--color. |

Alternative 2--color. |
Alternative 1--gray. |

Alternative 2--gray. |