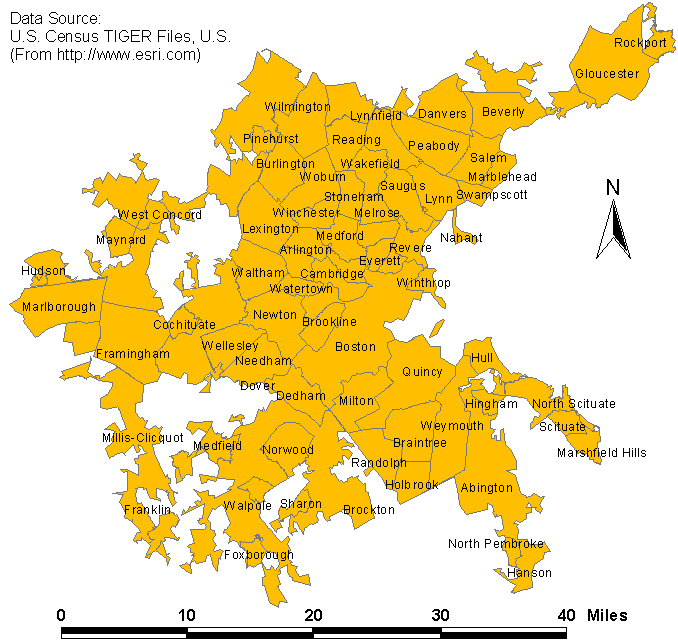
Maps 1 and 2 below show the study
area. Map 1 shows it at the state-wide scale and Map 2 shows the
Greater Boston boundary in detail. Numerous smaller cities are located
within the latter boundary. The projection employed in these two
maps, and in all maps created in GIS software for this article, is State
Plane, 1983, Massachusetts, Mainland.

(Click the picture to see details.)
Map 1. Metropolitan Boston in Massachusetts
(Click the picture to see details.)
Map 2. Cities in Metropolitan Boston Area
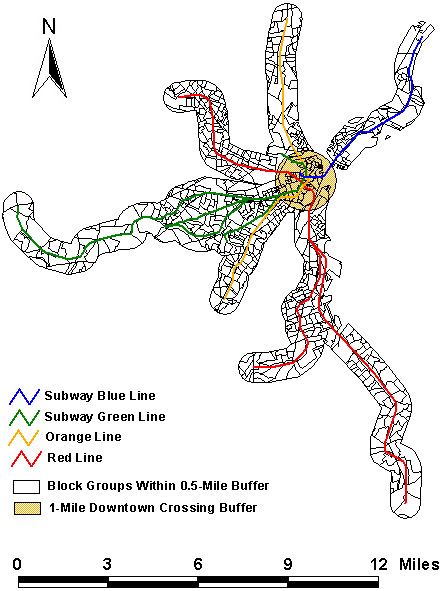
New layers for subway stops (points) and routes (lines) were created on exact locations with heads-up digitizing based on street layers (Map 3). After creating new datasets for Greater Boston area, three additional datasets were made for specific, focused study areas: 1-mile and 0.5-mile buffered block groups along with subway lines and 1-mile buffered block groups from the center of the Downtown Crossing, Boston, where all four subway lines intersect (hence, "Downtown Crossing").

(Click the picture to see details.)
Map 3. Subway System of Boston
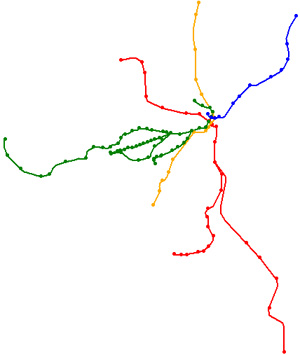
(Click each subway line to see the
route map, or the
entire system map. )
Map 4. Subway Lines and Stops
Study Area: Subway Buffer Zones
An animated map shows how single buffer zones were created based on subway stop pattern; it also shows the detail of merging single buffers to present a unified, system-wide single buffer.
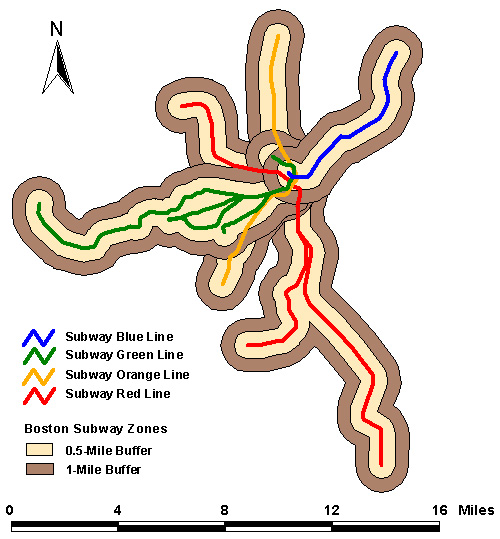
Map 5. Subway Buffer Zones
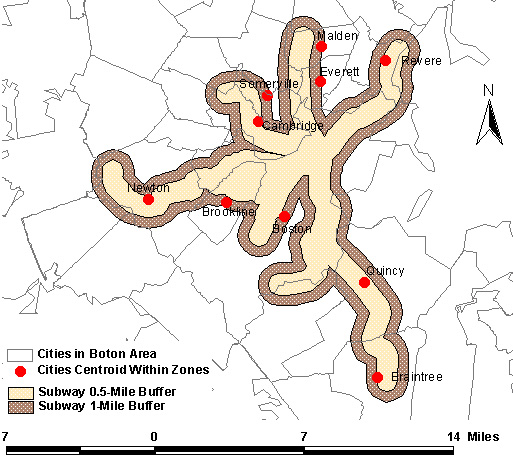
The next step involved finding target cities. Cities were selected as lying within a 1-mile subway buffer zone if the centroid of the polygon representing their municipal boundaries lay within that buffer. In the case of concave polygons whose centroids lay outside the concave polygon, the centroid of the convex hull was used, instead. Using this procedure, 10 of a total of 65 cities were selected as shown on Map 6.
(Click the picture to see details.)
Map 6. Cities Cetroid Within Subway
Buffer Zones
Study Area: Downtown Crossing
(Click
here to see the zone zoomed in.)
Map 7. Downtown Crossing 1-Mile
Buffer Zone
SUBWAY ZONES IN BOSTON, MASSACHUSETTS / PROJECT TARGET