The last part of this project considers
a more microscopic view of the Boston urban surroundings, in the downtown
crossing area, a circle of 1 mile radius centered on the downtown heart
of the MBTA (Map 21). Two major issues guided the mapping effort that attempts
to reveal a socioeconomic story: display the distribution of ethnic
groups within the Downtown Crossing and display the distribution of housing
within the Downtown Crossing.
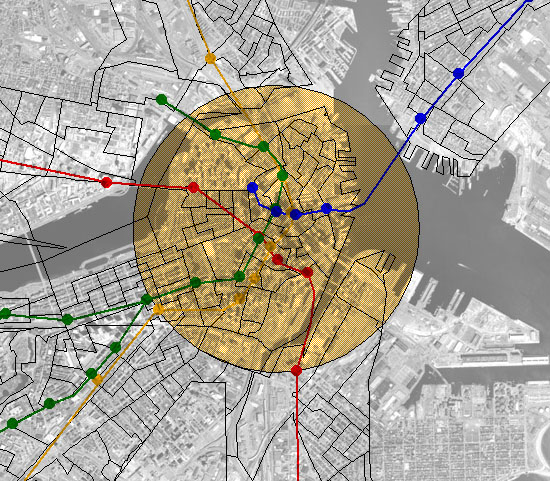
(Click the map to see details.)
Map 21. Focused Study Area: 1-Mile Downtown-Crossing Zone
Maps 22 to 25 display the proportions
of Whites, Blacks, Asians-Pacific Islanders, and Hispanics in the Downtown
Crossing Area (data source, U.S. Census Bureau block group data).
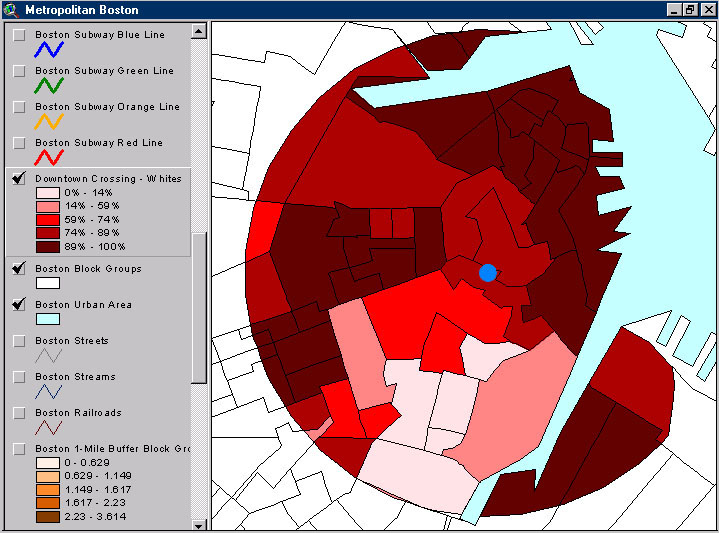
Map 22. Distribution of Whites in Downtown Crossing |
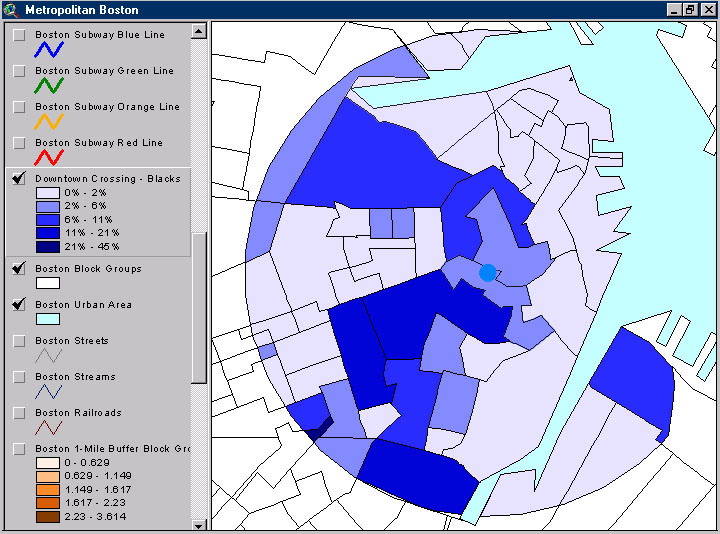
Map 23. Distribution of Blacks in Downtown Crossing |
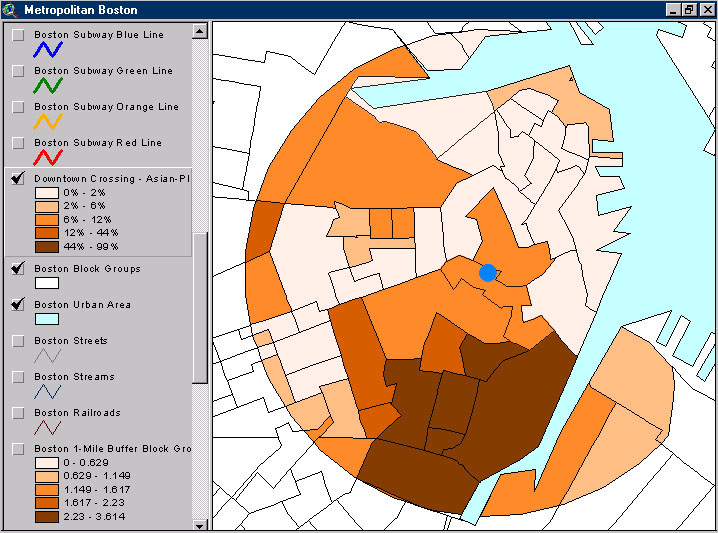
Map 24. Distribution of Asians/Pacific Islanders in Downtown Crossing |
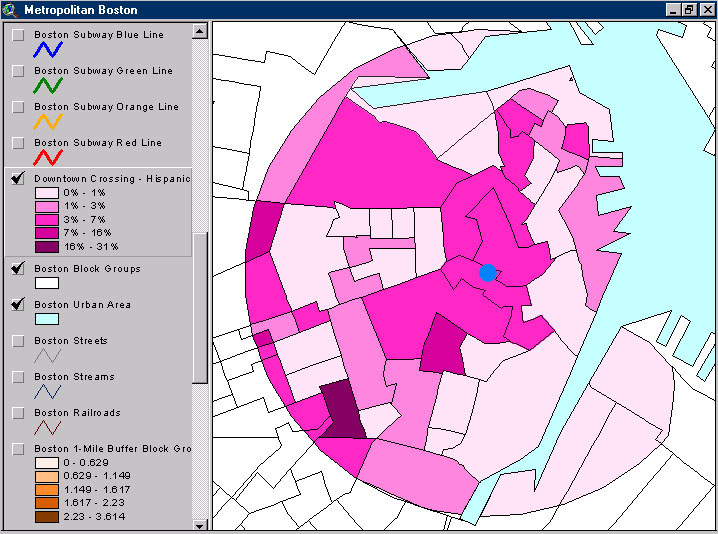
Map 25. Distribution of Hispanics in Downtown Crossing |
The white population dominates the harbor front (Map 22). The lowest concentrations of black population appear to be centered in block groups not containing the highest concentrations of white population (Maps 22 and 23). Asian/Pacific Islanders, mostly Chinese, have settled in "China Town" at the south end of the Downtown Crossing Area (Map 24). In China Town, home and business often share the same site. With other ethnic groups, home and business are typically separated. Thus, cross-cultural comparisons based on quantitative analyses of numerical data is difficult as concentration of activity is not accounted for consistently in such analyses. In cases where numerical associations are clouded by subtle cultural cross currents, it can be important to use the evidence of maps to look for pattern in graphic evidence not readily discernable in the underlying databases.
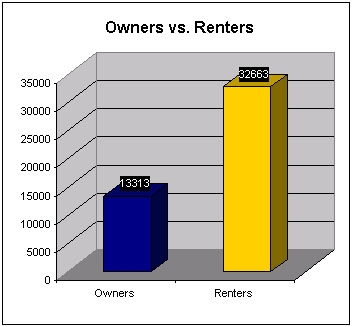
In the Downtown Crossing Area, there
are numerous rental units. The ratio of owners to renters, as shown
in Figure 5, is about 2.5:1. Like most metropolitan cities in the
U.S., the proportion of renters occupying downtown units is much higher
than the proportion of owners occupying downtown units.
(Click the map to see details.)
Figure 5. Owners vs. Renters in Downtown Crossing
What are the implications of this
fact for the residents of China Town, where home and business may share
the same unit? Are residents of China Town typically property owners
whose home-based businesses might help to build an enduring cultural enclave
and offer the sort of stability that comes from commercial and residential
continuity? Or are they typically renters, dependent on low rental
fees in order to survive? The answer is important. In the former
case, a stable enclave helps to build a vibrant south end of the Downtown
Crossing Area. In the latter case, transient renters seek the lowest
rental fees thereby simultaneously jeopardizing residential and commercial
stability of this region of Boston.
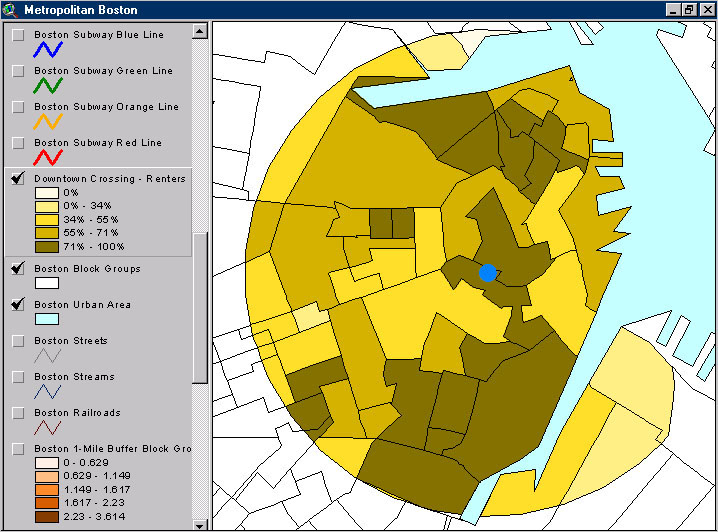
Map 26. Distribution of Renters in Downtown Crossing |
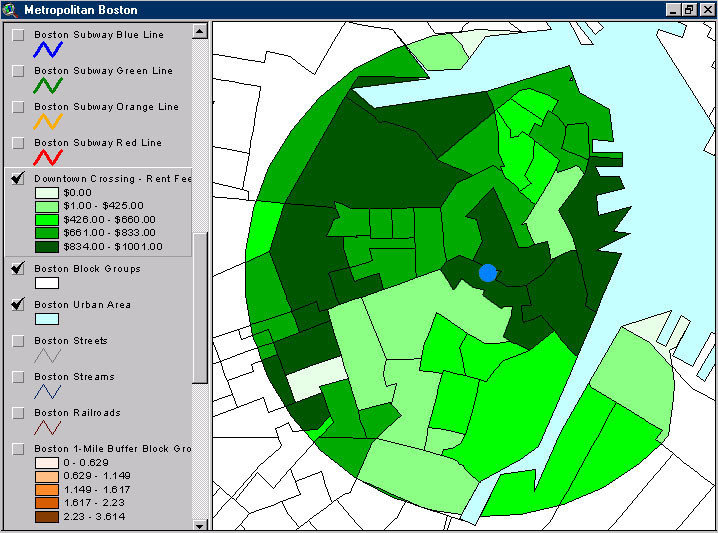
Map 27. Distribution of Rental Fees in Downtown Crossing |
Maps 26 and 27 suggest an expected
association between renters and rental fees: renters go where the
rental fees are low. Map 28 couples this idea with the concentration
of the Asian population in the Downtown Crossing area. It suggests
a strong association between low rent and the high concentration of activity
in China Town: it appears that the bleak simultaneous jeopardy scenario
is the one that is in force. Map 29 also offers spatial evidence in moderate
support of this idea, as well. When this scenario is coupled with
data more current than the 1990 data on which this map was based, it might
serve as a guide to more focused numerical research that disaggregates
the multiple use of residential and business in the south end of the Downtown
Crossing Area. Careful analysis might suggest direction to policy
makers for enabling greater stability in this region.

(Click the map to see details.)
Map 28. Renters vs. Asians

(Click the map to see details.)
Map 29. Rental Fees vs. Whites
These maps suggest a story. Will this story affect decision-making and policy analysis in urban development?
SUBWAY ZONES IN BOSTON, MASSACHUSETTS / DOWNTOWN CROSSING