DDA:
Taskforce to increase residential in the downtown
May 10, 2004
Audio
file of Public Hearing of April 27, 2004, delivered in full form on
CD, as a .wav file, to DDA;
edited version supplied
here, about 5MB, takes about 1 hour to play
(only voices of Taskforce members or public
officials are heard; last voice is that of John Hieftje, Mayor of the City
of Ann Arbor)
The 3D modeling of the entire DDA is done
using ESRI software so that the model works directly from existing city
base map GIS files and associated database files. The GIS is driven
by the underlying database. Hence, all information needed to do the
mapping is available in the database (.dbf) files (which can be opened
in Excel). Here is some more information from the various databases
associated with the variety of files (over 2000) generated in association
with the various 3D models created in response to Ordinance Revision Committee
(Planning Department and Commission), Taskforce, and other request (that
has been ongoing over the past 2 or so years)
There are 739 buildings on 755 parcels
in the DDA (some parcels have more than one building); some parcels have
less than one building (a building overlaps more than one parcel), as with
One North Main, Campus Inn, and Sloan Plaza. Some of the new buildings,
on vacant land or surface parking lots, also overlap more than one parcel,
as in the Brown block or the Library block...and elsewhere in the yellow
layer. There are 418 parcels in the set of target parcels (see below*
for definition) and 405 buildings on target parcels (again, some overlapping
parcels but more frequently, there are multiple buildings on a single parcel).
Vacant or Surface Parking parcels
-
Square footage of vacant parcels in the DDA:
770,346 square feet.
-
Square footage of target vacant parcels in
the DDA: 620,008 square feet. Buildout to the 2/3 level, in
400,000 square feet, in 10 story buildings (covering the parcels) would
provide 4,000,000 square feet; in 12 story buildings, 4.8 million square
feet.
Parcel inventory:
Square footage background of base layer:
-
DDA parcels, total: 8,269,459
-
Target* DDA parcels, total: 3,503,980
* a target parcel is a DDA parcel that
is not: public land, in an historic district, in the
Allen Creek floodway, such that its centroid lies in the Allen Creek floodplain,
a church parcel.
Thus,
-
If half of each target parcel's footprint
were covered, there would be about 1.75 million square feet to work with.
-
If we need to generate 7.5 existing plus 5
million new, then that means each parcel, on average would need to support
a building of 12.5 / 1.75 or about 7 stories.
-
If we need to generate 7.5 existing plus 2
million new, then that means each parcel, on average would need to support
a building of 9.5 / 1.75 or about 5.5 stories.
-
If 1/3 of each parcel's footprint were covered,
there would be about 2 million square feet to work with.
-
If we need to generate 12.5 million, then
that means that on average each building would be 6 stories.
-
If we need to generate 7.5 existing plus 2
million new, then that means each parcel, on average would need to support
a building of 9.5 / 2 or about 4.75 stories.
-
If 1/4 of each parcel's footprint were covered,
then there would be about 2.325 million square feet to work with:
-
If we need to generate 12.5 million, then
that means that on average each building would be 12.5/2.325 or 5.4 stories.
-
If we need to generate 7.5 existing plus 2
million new, then that means each parcel, on average would need to support
a building of 9.5 / 2.325 or about 4 stories.
Building inventory, smaller than
parcel inventory
The following table answers the following
questions:
How many square
feet are there currently in the built buildings? How many if all
premiums were used? How many if all buildings less than 6 stories
were to grow to 6?
In the target
population, using building footprints, same questions as above--then, how
many new square feet are brought in, in the target parcels, by such vertical
add-ons?
|
Current |
All Premiums Used |
Six by right |
| All Buildings |
7.5 million |
13.4 million |
15.6 million |
| Targets, only |
4.9 million |
8 million |
9.3 million |
| New for targets |
a |
3.1 million |
4.4 million |
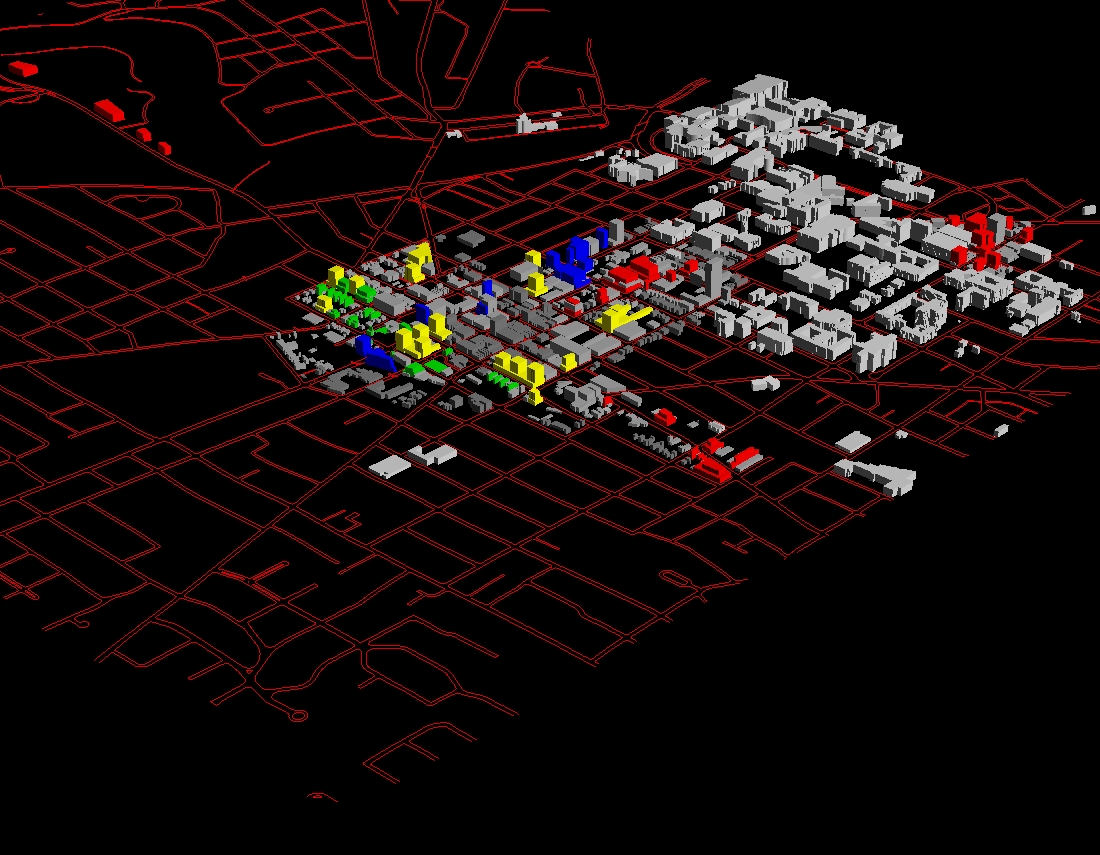
May 10:
Response to public hearing in relation
to 3D model buildout:
-
Square footage of yellow layer, increased
coverage coming from height reduction, all on vacant or surface parking
parcels, 8, 10, 12: 1,965,758 square feet or about 1000 new apartments--SO,
in the short run, 1000 new apartments come from about a 2/3 buildout of
existing vacant and surface parking
-
Square footage of blue layer along Huron Street,
8 (south side), 10, and 12: 996,767.4-258,847 = 737,920 square feet
of new or about 370 new apartments--height reduction, fine-tuning of historic
district parcel base map, sensitivity to building over Sloan Plaza and
so forth on that block of Huron Street. Also placed with an eye to
optimizing amount of new square footage and to reducing interaction with
existing residential (but needs fine-tuning in that regard).
-
Square footage of red layer,
-
remaining the same as before
-
Liberty--8 story buildings with a 3 story
plinth: 462,626.76
-
First and Ashley--4-6 story buildings with
a 3 story plinth, 50/50 mix--two of the six story buildings are located
on First; all others on Ashley: 385,128
-
S. Main: 323,628
-
altered:
-
N. Main--half the buildings removed:
635,812
-
S. University--new buildings added, at 8,
10, and 12 stories, consistent with setbacks of existing buildings, placed
to optimize (somewhat) amount of new square footage.
923,546.68 - 83208.9017 = 840,337.7783
Total in this model, with expanded yellow
layer reduced in height and the addition of S. University along with a
reduction in the blue layer and in the N. Main layer: 5,351,209.778
Click here for virtual reality; download
Cortona
or Cosmo Player, first, then view in your browser. There is the same
set of viewpoints as previously available plus two new ones along South
University.
Colored
virtual reality model
Grayscale
virtual reality model
An additional color (green) might be used
to separate, visually, the Ashley/First buildings from others. Added
colors may offer certain focused clarification of the model; however, they
also fragment the visualization power of the model, as a whole. There
are merits and drawbacks; the needs of individual cases will determine
how many colors to use.
Animations of selected viewpoints from
the Virtual Reality files; please feel free to suggest other viewpoints
to put into the VR files.
Sequence of animation frames: gray
is existing followed by taller scene of April 27 followed by shorter scene
of May 10.
View from South Main
View from Main and William
View from Main and Washington
View from Main and Huron, looking North
View from Main and Huron, looking West
View from Main and Huron, looking East
View along Huron looking East from the
west side
View along Huron looking West from State
View along S. University looking East from
the Diag
View along S. University looking West from
Washtenaw
Links to similar approaches:
http://depts.washington.edu/~uweek/archives/1998.08.AUG_06/_article2.html
Solstice: An Electronic Journal of Geography and Mathematics,
Institute of Mathematical Geography, Ann Arbor, Michigan.
Volume XV, Number 1.
http://www.InstituteOfMathematicalGeography.org/