Surface flow and
steep slopes resource page.
Preliminary model.
Sandy Arlinghaus.

BASE MAPS FROM THE CITY.
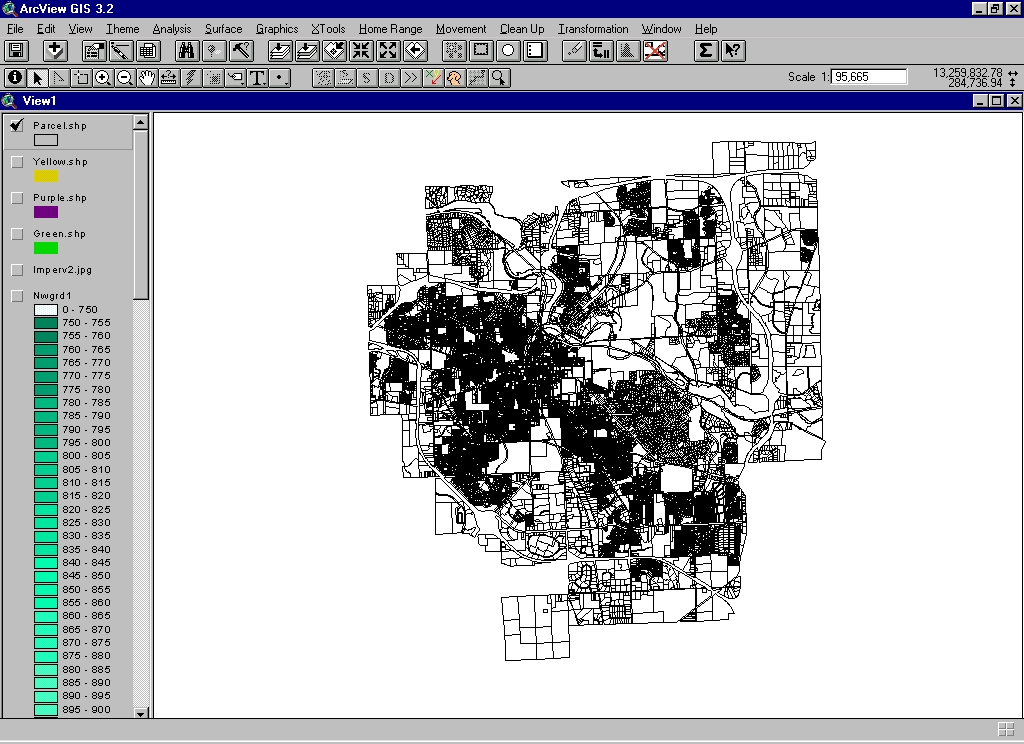
Parcel map of the City of Ann Arbor (source: City Hall.
Map accuracy standards are known by them.)
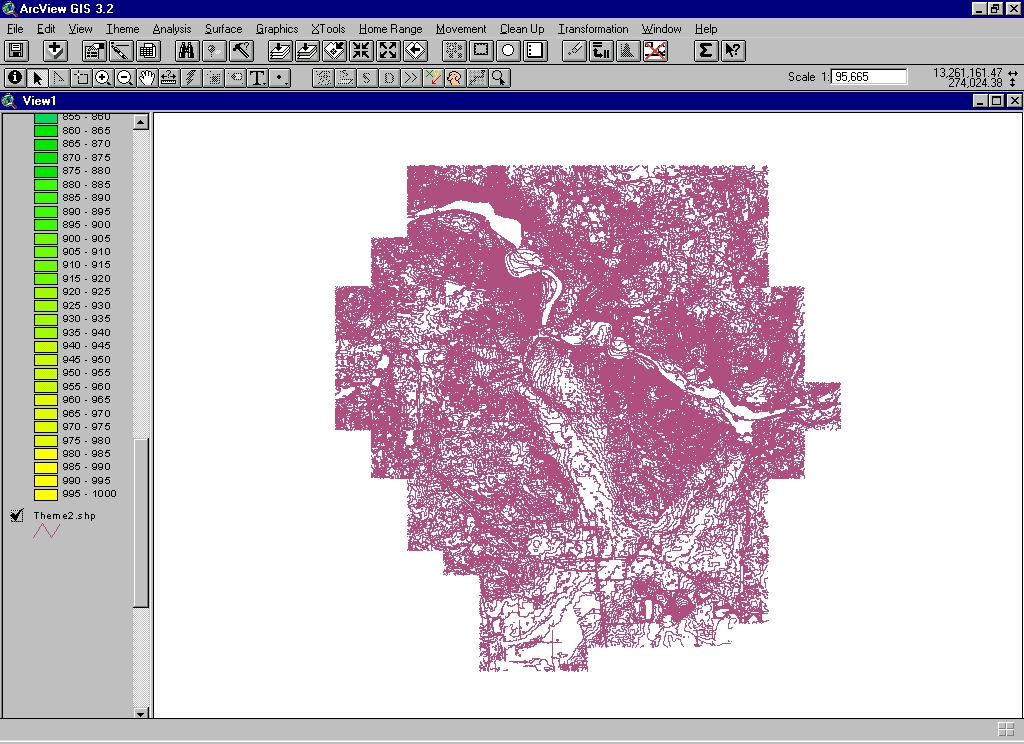
Map of the City of Ann Arbor, 5 foot contour interval (source:
City Hall. Map accuracy standards are known by them). The database
behind this map has a field for "elevation" expressed in feet. Only
the northern third of the City has non-zero data in this column.
Thus, analysis of the contours using any quantitative analysis based on
elevation produces results only for the north. A more current map
with a completed database would be very useful (if there is none, then
completion of it could be a worthwhile student project).
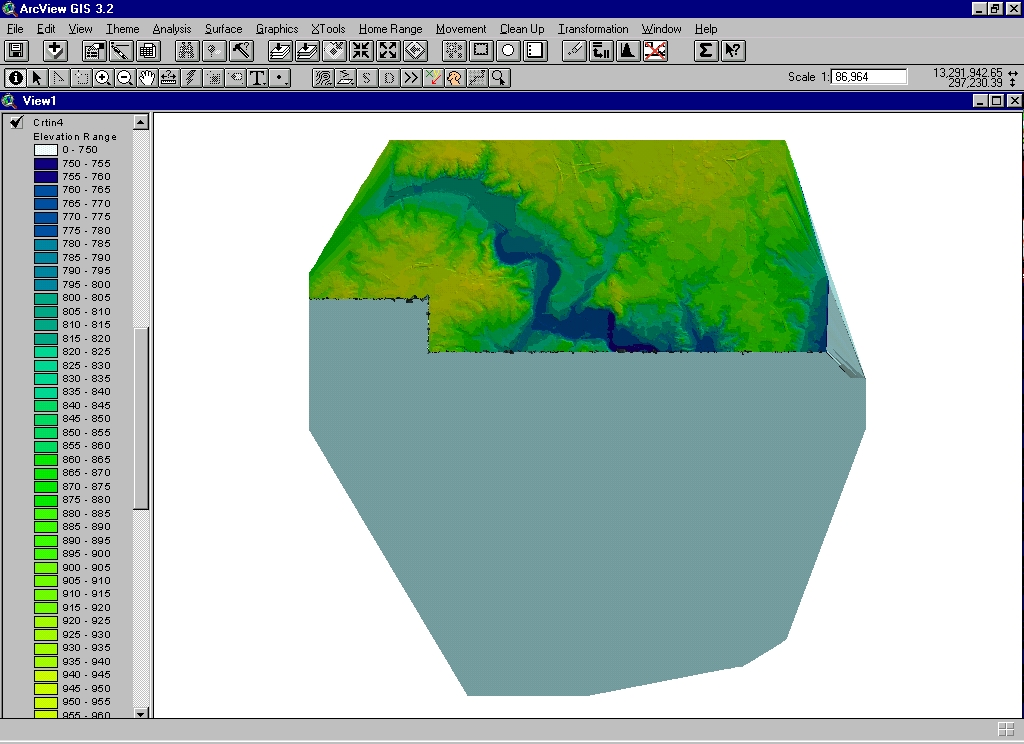
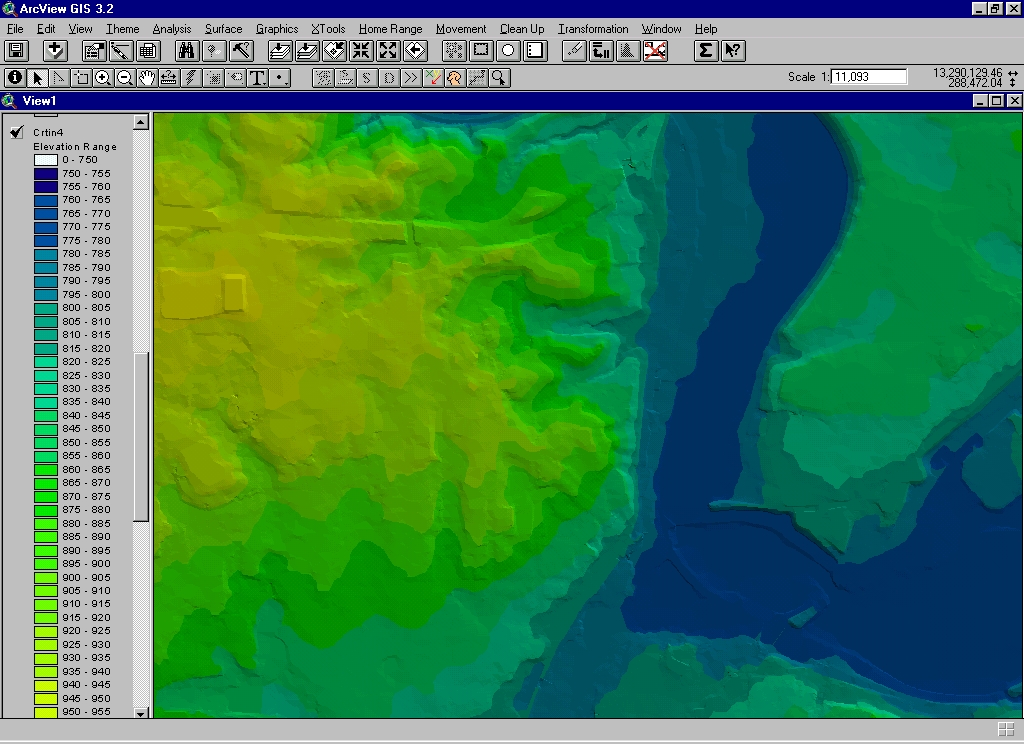
Triangulated Irregular Network (TIN)--entire City at once (as per limitations
of elevation data, above--the gray/blue area has zero elevation according
to the database and was included here only to indicate City boundaries).
A TIN joins nearby digitized points into triangular facets that produce
a 3D appearance. Here, the data is split into 5 foot intervals (to
match the contour interval). Note the outlets of Traver Creek and
of Allen Creek into the Huron River--what is colored blue is between contours.
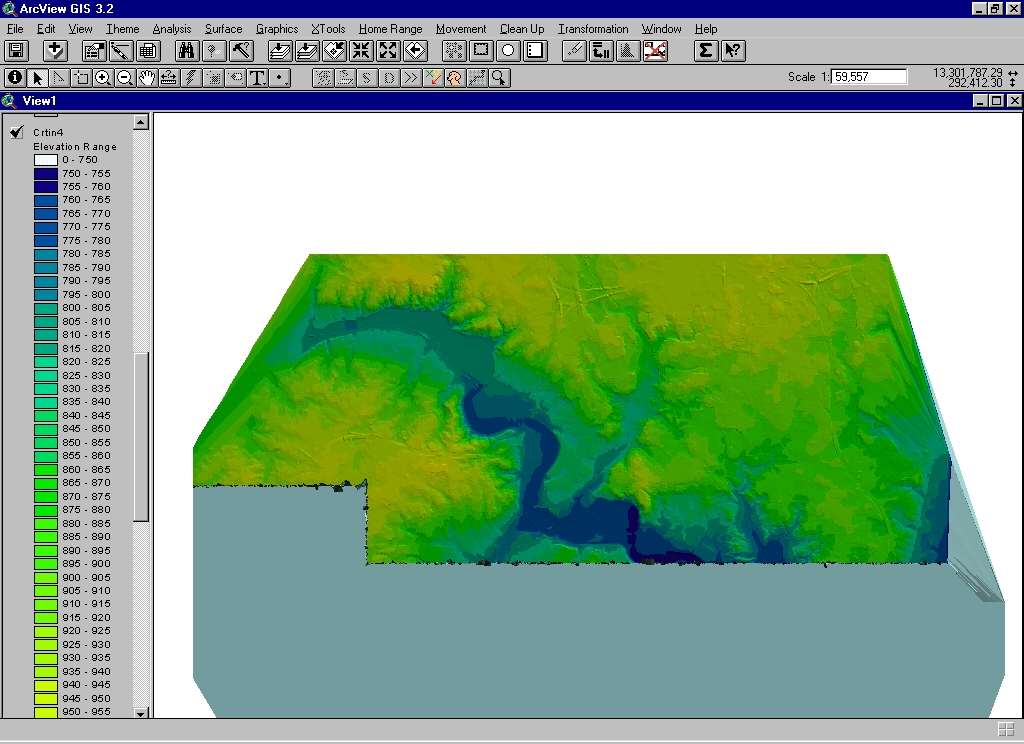
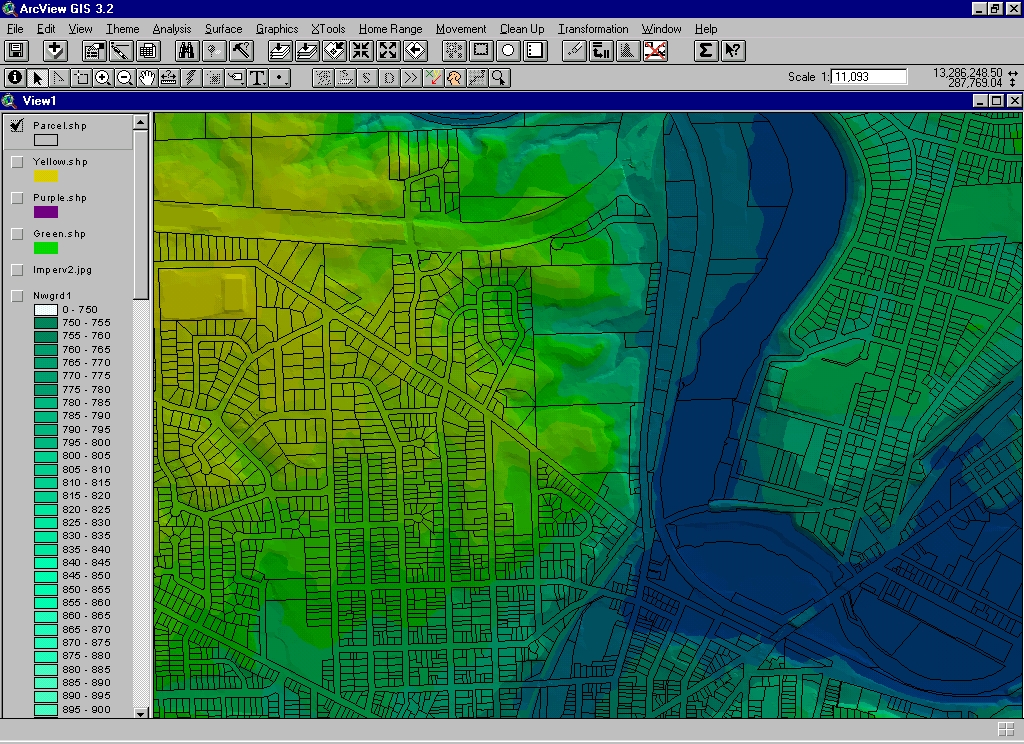
Zoom-in: shows portion for which there is elevation data
Zoom-in farther: shows steep portion along the river
Parcel map superimposed on map above.
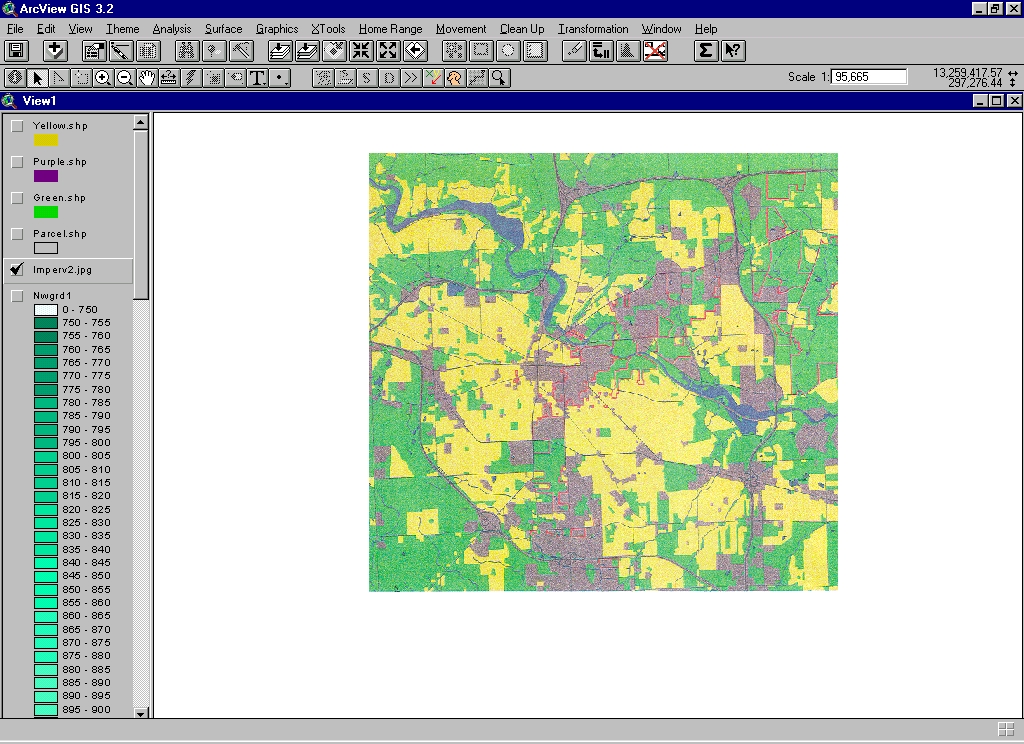
Impervious surface map.
The map below is a scanned image from the first Venturi, Scott Brown,
and Associates document, The University of Michigan Campus Plan, Ann Arbor,
Michigan, Phase 1 Overview. We do not have the electronic files.
The quotation below is taken from that document.
"This classification scheme, provided by SEMCOG, for urban
stream water quality potential is based on imperviousness (Schueler 1994:
Tom Schueler, The Importance of Imperviousness, Watershed Protection Techniques,
Vol. 1, No. 3, Fall, 1994). Impervious surfaces include roads, parking
lots, rooftops, and other impermeable surfaces usually associated with
urban landscapes.
Increases in impervious surfaces have negative
effects on the hydrologic cycle. The impacts that may ensue include:
increased flooding nad stream bank erosion, greatly diminshed water quality,
degraded habitat, reduced groundwater recharge and reduced baseflow, and
the addition of pollutant loads from stormwater runoff."
Legend for the maps below:
When present, the bold red line indicates university boundaries.
1995 percent impervious cover (characterization of ranges from VSB
document--unknown what happens between 10-11 and 25-26):
green: Low impervious area (0%-10%). Potentially
sensitive streams.
yellow: Moderate impervious area (11%-25%). Potentially
impacted streams.
purple: High impervious area (26% or greater). Potentially
severely impacted streams.
Base map source: UM Facilities, Planning and Design.
Information Source: Southeastern Michigan Council of Governments.
The map has no projection shown on it (it does have scale, orientation,
and date).
The scanned image is placed behind the City parcel map. The projections
do not fit exactly but are close. In order to get the VSB map into
a GIS form, one might consider digitizing the VSB map; then, however, the
digitized map would not fit exactly with the City maps. Instead,
I chose to overlay the parcel map on the VSB map and make a decision about
each parcel--whether it fell into the green, yellow, or purple category
of the VSB map. The lines of partition in the VSB map do not correspond
with the City parcel map; presumably, the VSB parcel boundaries are those
of the county land use parcels, or some such; they are not the city parcel
boundaries. Thus it is useful to include the VSB map in any analysis
that might use the parcel map colored by impervious type. The advantage
to having a parcel map colored by impervious type is to be able to make
estimates per area (creekshed, for example) of the amount of yellow land
by parcel within that creekshed. This map is not yet complete.
Randy Deshazo, graduate student, College of Architecture and Urban Planning
is helping with this task.
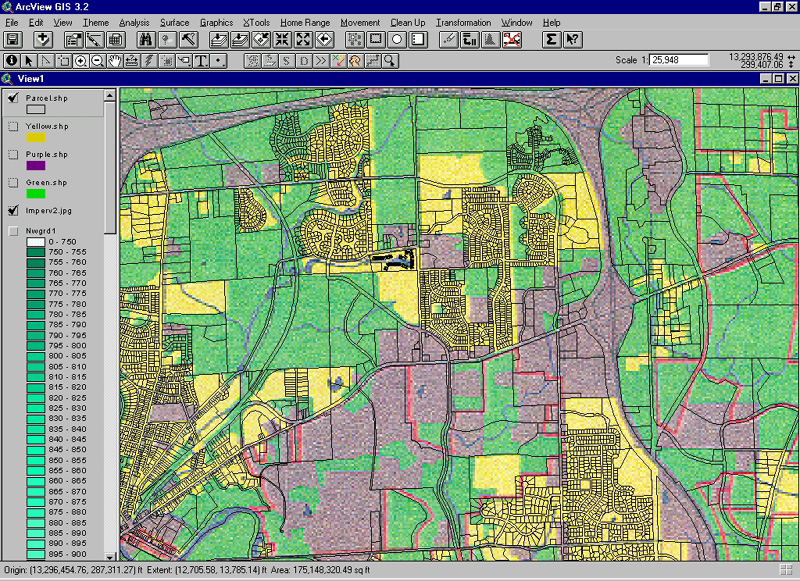
A closer look illustrates the process.
Consider a map of part of the northeast area, centered generally on
the Plymouth, Huron Parkway, and Nixon interchange.
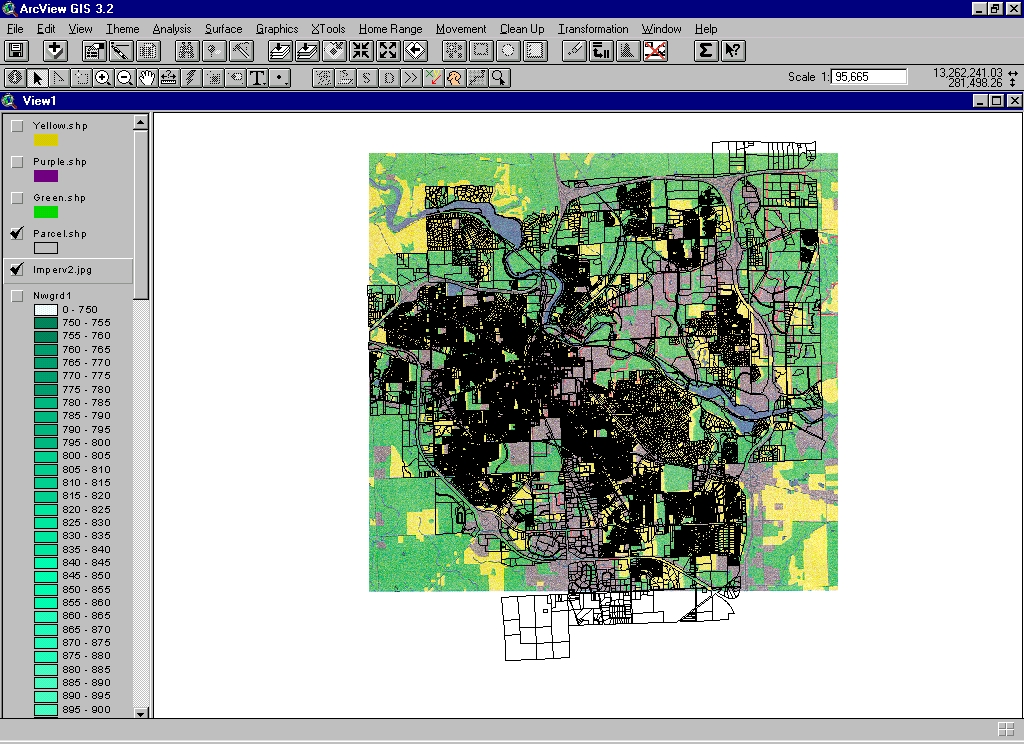
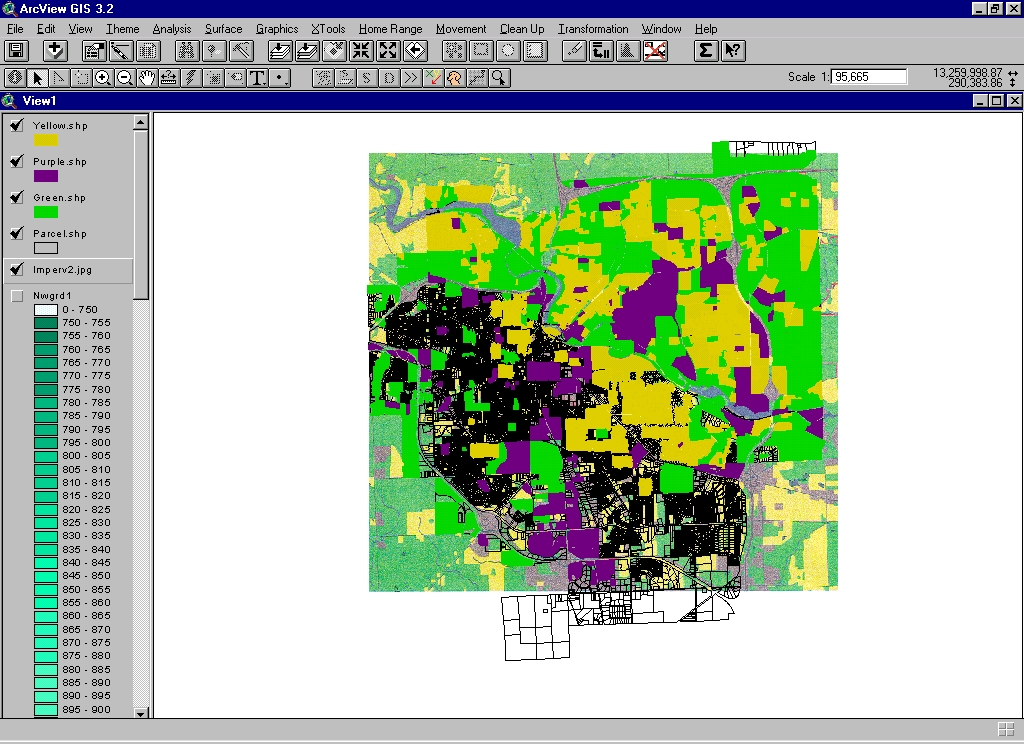
The map below shows the City parcel map superimposed on the impervious
surface map from the VSB document. For some purposes this map may
be all that is needed. It has no electronic data behind it; it is
simply backdrop or wallpaper behind the parcel map. Notice that the
alignment is a bit off; this is due to projection differences.
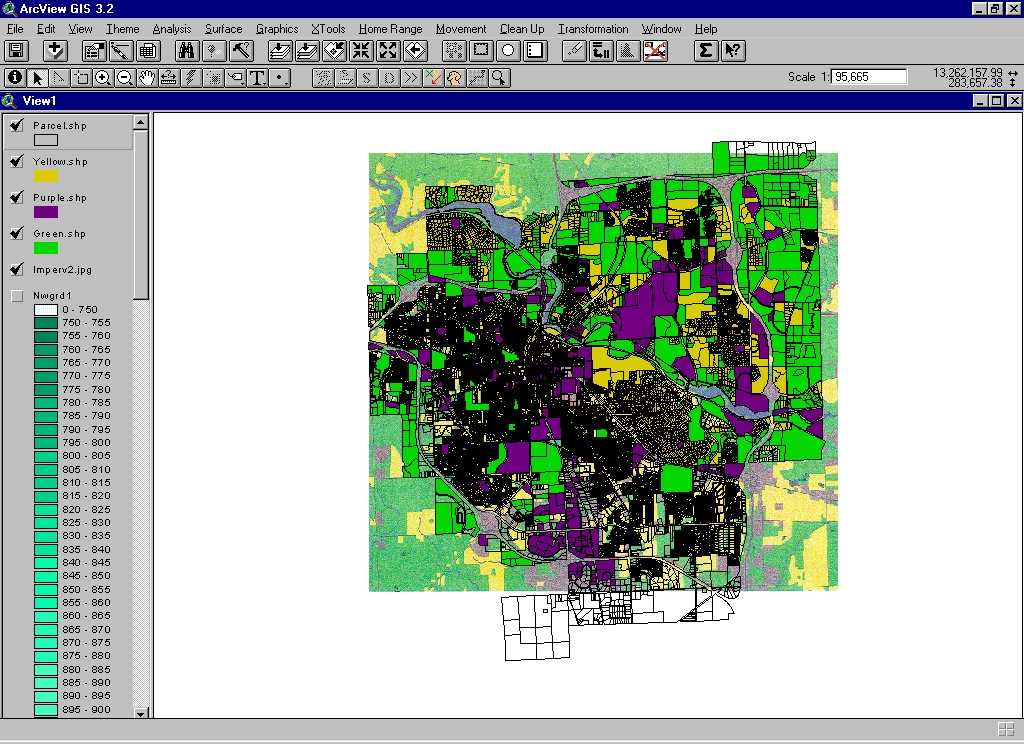
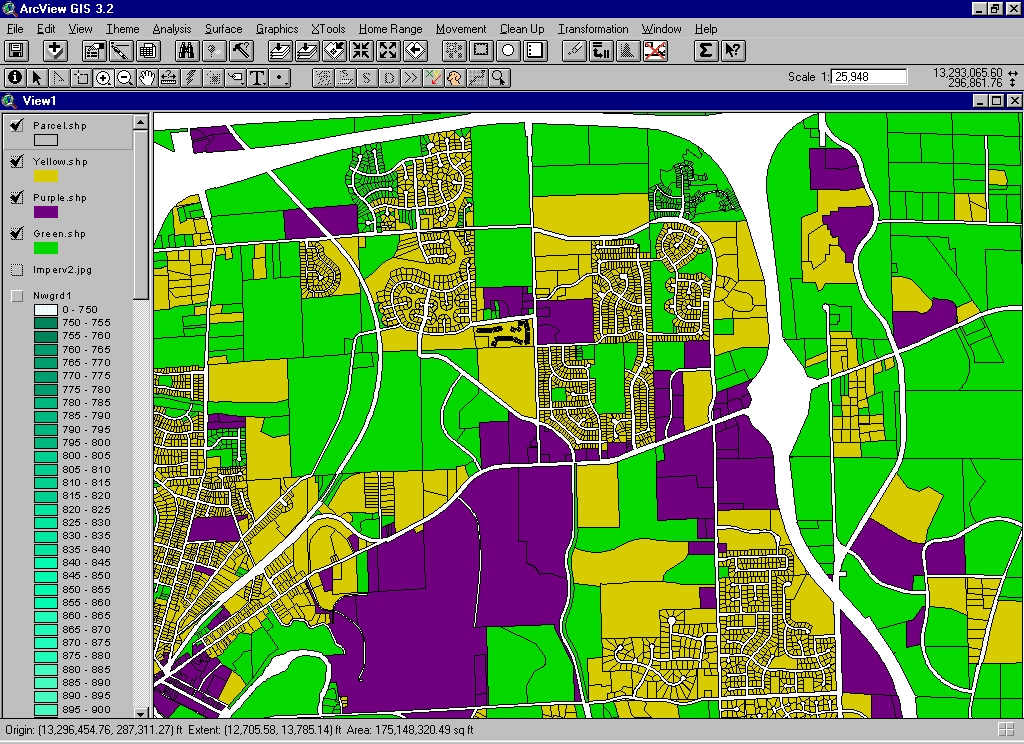
The map shown below is one derived from the map above. The parcels
that appear to be predominantly purple (or yellow or green), looking at
the parcel map superimposed on the VSB map, are colored purple (or yellow
or green) in a shape file in ArcView so that the impervious surface information
is captured in the GIS for use with any other layers of City maps or data.
Links:
Steep slope ordinance summary: City
of Highland Park, Illinois.
City of Ann Arbor Home Page