Ann Arbor, Michigan:
Virtual Downtown Experiments
Sandra Lach Arlinghaus
The University of Michigan
with input in varying degrees
from the individuals noted at the end of this article.
sarhaus@umich.edu
http://www-personal.umich.edu/~copyrght
The problem of where to locate tall buildings, with sensitivity to existing
building types on adjacent and nearby lots, is a difficult one. In
Ann Arbor, building height is currently limited by "floor area ratio" (FAR).
The FAR is calculated as the ratio of floor area in a building divided
by parcel area, times 100. If a given parcel has an FAR of 100, then
a building footprint built lot line to lot line may have a height of 1
story. If a parcel has an FAR of 200, then a building footprint built
lot line to lot line may have a height of 2 stories. Similarly, an
FAR of 300 yields a building of height 3 stories covering the entire parcel.
Thus, on a parcel with an FAR of 300, one might, instead, build a building
on half of the lot area but of height six stories, or on a third of the
lot area but of height 9 stories. On the same parcel, a 30 story
building could be built only if its footprint covered one-tenth of the
land area of the parcel. The FAR provides a height limit based on
the size of foundation needed to support a tall building. It also
offers subtle encouragement for preserving some amount of open space and
visual variation in the region to which it applies. The drawback
is that a tall building may get built with no regard to the broader context
of how a new building will fit in with existing buildings on the surrounding
parcels. A possible side effect of using FAR (alone) to limit height
is that it might encourage parcel amalgamation by large developers, thereby
driving out desired local small business owners. [Note: in
Ann Arbor, there are also "premiums" designed to encourage residential
construction, and other uses viewed as "desirable" in the downtown; these
allow an increase in FAR. They will not be covered in this abstract
discussion.]
The FAR is assigned by zoning type. In the downtown, there are
currently parcels assigned to each of 22 different zoning categories (AG,
C1, C1A, C1AR, C2A, C2AR, C2B, C2BR, C3, M1, M1A, M2, O, P, PL, PUD, R1D,
R2A, R2B, R4B, R4C, R4D). Roughly speaking, any category beginning
with C is a commercial category; M is for manufacturing; R is for residential.
The AG category is for agricultural zoning, O is for office, P (except
for PUD) is for Public Land (as for the University of Michigan which, as
a State university, contributes no funds to the city taxpayer economic
base), and PUD is for Planned Unit Development. In Figure 1, the
animated map shows the City of Ann Arbor parcel map colored as a thematic
map by zoning category: the broad PL zoning is part of the central campus
of the University of Michigan. The curved line near the left side
of the map. representing the Ann Arbor Railroad corridor, has most of the
manufacturing parcels adjacent to it. Separate categories enter the
picture in sequence, arranged according to alphabetical ordering of zoning
category. The coloring scheme is exhaustive: every parcel is
covered. It is also mutually exclusive: no parcel has more
than one color. Thus, the zoning classification serves as a geometric
partition of the parcels.

Figure 1. Zoning animation of 22 zoning categories:
AG, C1, C1A, C1AR, C2A, C2AR, C2B, C2BR, C3, M1, M1A, M2, O, P, PL,
PUD, R1D, R2A, R2B, R4B, R4C, R4D. Zones enter the animation in alphabetical
succession. Attached labels are added in the final frame. |
Once an inventory of parcel categories is obtained by creating thematic
maps, the groups of parcels will be removed in accordance with various
ideas. The goal is to select targets of opportunity for taller projects
as illustrated below.
Animated maps are useful for showing change; static maps are useful when
one wishes to take a longer look at pattern without regard to change in
pattern. Thus, Figure 2 shows the final frame of the animated map
in Figure 1 along with a layer showing the boundary of the Downtown Development
Authority (DDA) in yellow, the railline in black/yellow, the floodway (channel)
outline of Allen's Creek in blue, and the floodplain outline of Allen's
Creek in cyan.

Figure 2. Zoning categories, DDA boundary, railline, floodway
and floodplain. |
The current interest is to consider only zoning categories, as the downtown
"core," of C1A, C1AR, C2A, C2AR, C2BR as those containing parcels
that are targets of opportunity for building structures of height greater
than that permitted by FAR. The current FAR in these categories is either
200 or 300. The idea is that there may well be parcels within these
core downtown areas that could support height in excess of that permitted
by the FAR. In Figure 3, the shading is removed for these zoning
categories; they are easily focused on as a grouping. When parcels
containing historic district designation (and relatively short buildings)
are superimposed on the pattern in Figure 3, further limitation of targets
of opportunity is the result (Figure 4). The historic district parcels
were inserted in a separate step because they overlap the standard zoning
hierarchy and are not a part of the geometric partition noted above.
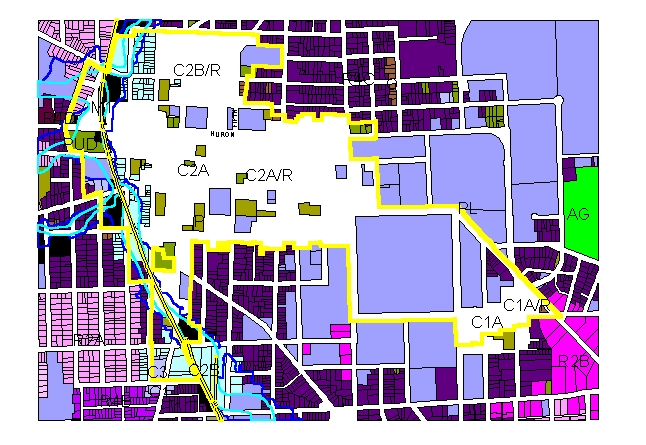
Figure 3. Shading is removed from C1A, C1AR, C2A, C2AR,
C2BR zoning categories--the downtown core--to visually group these regions
as those containing parcels that are targets of opportunity for height
in excess of that permitted by the FAR. |
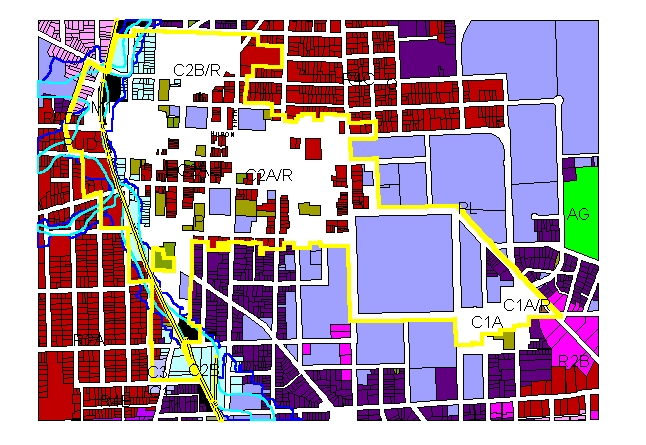
Figure 4. This map is identical to the map in Figure 3
with historic district parcels superimposed in red. The historic
district designation further limits the targets of opportunity. |
The white areas of the map in Figure 4 contain all the possible parcels
in the downtown core that do not carry historic district designation.
Some of them already have buildings built on them; others do not.
Those with buildings on them may become eventual redevelopment targets;
those with no buildings on them may be short-range targets. To take
a closer look at the area, insert an aerial photo of the DDA behind the
map in Figure 4 (as well as other items of possible interest, such as contours
to identify steep slopes). Figure 5 shows a zoom-in on part of the
white area; in that figure, however, the "white" area has been replaced
with aerial so that one can see directly the current content of all parcels
in the core that do not have historic district designation. One can
see what is on each parcel and might determine, therefore, a strategy for
targeting opportunities for development in excess of the FAR.
A current suggestion by the Planning Department staff and the Ordinance
Revisions Committee is to use the street hierarchy to select general target
areas: wider streets support taller nearby structures. Thus,
the zoom-in of Figure 5 is on Huron Street, the widest street in the DDA.
Use of the aerial not only permits quick determination of where parking
lots and existing buildings are located but it also shows shadow pattern
of existing buildings suggesting guidelines for upper story setbacks and
other tools that limit reduction of light. Light in the streetscape
is pedestrian-friendly (and vegetation-friendly), particularly at this
mid-continental latitude. Highest priority immediate targets of opportunity
for height in excess of that permitted by the FAR thus appear (from the
abstract representation in Figure 5 alone) to be in the large parking lots
visible along Huron Street, with suitable upper level setbacks to minimize
shadow in the street. Further analysis is needed, however, to include
steep slopes, opinion from members of the public and from developers, the
will of governing bodies, and various other acadmic and non-academic factors.
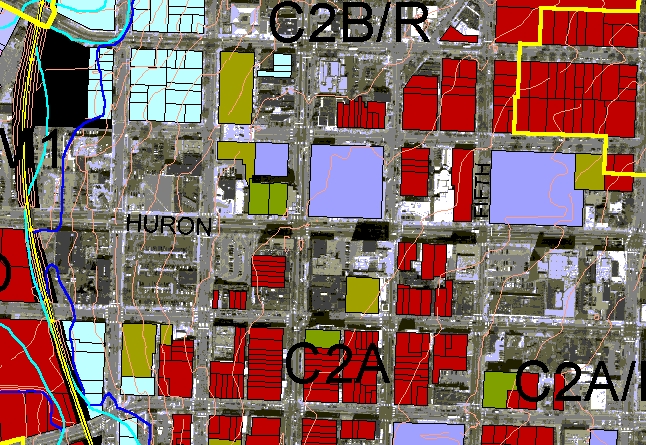
Figure 5. Zoom in--use the street hierarchy to suggest
locales--notice the shadows leaning out into Huron Street as well as the
content of the core area along Huron Street, from tall buildings to parking
lots. |
Dynamic maps, produced in Geographic Information Systems (GIS) software,
when coupled with high quality aerial photography produces powerful visualization
capability that can guide decision-makers. One limitation of this
visual analysis is dimensional: even though the aerials are high
quality, one still really has only a two-dimensional view of a three-dimensional
scene. The ideal would be to have dynamic three dimensional models
of the core area. Virtual reality (VR) affords such an opportunity
in two different ways: through web-based virtual reality and through
immersion in a virtual reality CAVE. Only the former technique can
be displayed in this article. The plan, beyond the VR experiments
in this article, is to take files such as these, place them in the CAVE
in the Media Union at The University of Michigan North Campus in Ann Arbor,
and invite policy makers to immerse themselves in the virtual reality created
by alternative height scenarios (report to come in a subsequent issue of
Solstice) in order to consider the issue of a maximum height ordinance
or any other zoning issues in the downtown.
To view the VR experiments below (Figure 6), first download Cosmo Player
and install it in your browser according to directions. Then, click
on the links below and practice navigating through the streets of downtown
Ann Arbor.
| FAR
Virtual Reality:: translucent buildings are superimposed, lot
line to lot line on parcels in the downtown core zones. This VR experiment
depicts the downtown with the simplest use of the FAR. [The DDA region
is shown in black; the Allen Creek floodplain in blue.] |
| Actual
height Virtual Reality: again, buildings are superimposed,
lot line to lot line, on parcels in the downtown core zones. This
VR experiment depicts the downtown using actual building heights, where
known. [The DDA region is shown in gray; the Allen Creek flooplain
and floodway in shades of blue; building color is according to height category.] |
| Figure 6. Virtual Reality experiments performed using ArcView
GIS, v. 3.2, with Spatial Analyst Extension and 3D Analyst extension (from
ESRI).. |
The title of this article contains the word "experiment." There
remain many directions one might move from these initial experiments in
order to use maps, aerials, and virtual reality as a guide to decisions.
Some of these next steps are enumerated below.
-
Digitize the aerial photograph of the DDA so that VR can be constructed
on actual building footprints rather than only on a parcel outline basis.
-
Field-check building height measurements.
-
Introduce final files into an immersion CAVE environment and invite policy-makers
to immerse themselves in various 3D alternatives for height in the downtown.
-
Consider other patterns for zoning in the downtown. For example,
one might begin with the historic district designations and buffer these
with fringe areas of various heights supporting gradually increasing heights
away from historic buildings (as constrained by a number of variables such
as with road width or street hierarchy, proximity to residential zoning,
steep slopes, design standards, or various other factors). Thus,
a new geometric partition of parcels, based on historic designation, would
emerge.
-
Recommendation and implementation of any policy for limiting height in
the downtown is beyond the scope of any of this material.
The author acknowledges productive meetings with and assistance from
-
her colleagues on the City of Ann Arbor Planning Commission (Sandra Arlinghaus
(Chair), Kevin McDonald (Vice-Chair), Scott Wade (Secretary), Braxton Blake,
Jean Carlberg, Kristen Gibbs, Christopher Graham, William Hanson, and Steve
Thorp);
-
the Ordinance Revisions Committee of that Commission (Hanson, Chair; Carlberg,
Arlinghaus, Blake);
-
the City of Ann Arbor Planning Department staff (Karen Hart, Planning Director;
Wendy Rampson, Coy Vaughn, Donna Johnson, Jeff Kahan, Chandra Hurd, Alexis
Marcarello, Chris Cheng, and Matt Kowalski);
-
Merle Johnson, City of Ann Arbor, Information Technology Services;
-
Heather Edwards, Historic District Preservation Coordinator, City of Ann
Arbor; and,
-
the Mayor of Ann Arbor, His Honor, John Hieftje.
Software used: ArcView GIS, v. 3.2, with Spatial Analyst Extension
and 3D Analyst Extension. All from ESRI (Environmental Systems Research
Institute, Redlands, CA).