
Version 0.10:
drawcurv.exe (3.2 Mb)
drawcurv-0.10.zip (1.3 Mb)
drawcurv-0.10.rar (1.0 Mb)
Version 0.9:
drawcurv.exe (3.2 Mb)
drawcurv-0.9.zip (1.3 Mb)
drawcurv-0.9.rar (1.0 Mb)
|
|
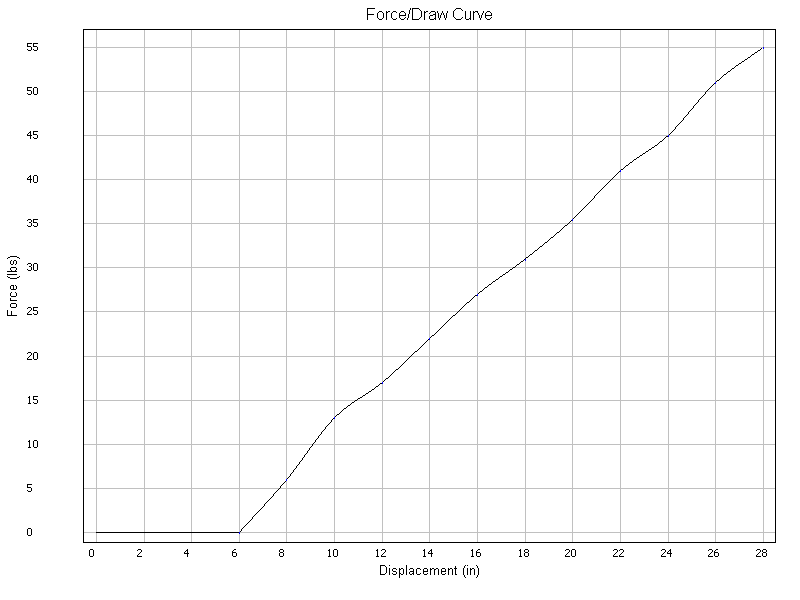
This is a utilty for manipulating and visualizing force/displacement data. It contains a graphing utility and energy approximation. The two methods of data interpolation are linear and cat-mull rom. The Cat-Mull method is a type of spline that will fit a smooth curve that intersects all given points. The utility can also convert all measurements from english to metric and back, providing an easy means of producing share-able graphs regardless of locality.
Note: This document is not complete. It is just a basic rundown. I will try to be more thorough in a future revision.
Data is entered and modified in the upper right box. To add values, fill out
the data and either press the 'Add' button or hit enter. You can also hit tab
to move between fields. To update fields, highlight the entry in the list, change
the values in the boxes and then press the 'Update' button. Remove entries by
highlighting and pressing 'Remove'. It is recommended to begin with the brace height
with force 0.
You can convert from English to Metric by first selecting the units that you used
to enter that data. Note that this does not change any values. To perform the
conversion, hit the 'Convert to xxx' button next to the Units box. The button
will always convert to the opposite of the units that are selected. For obvious
reasons it is not a good idea to change the units after converting. This causes
the old conversion data to be nullified and recalculating it may cause roundoff
errors.
You can load and save files with the 'Save' and 'Load' buttons, and also through
the file menu. If you wish, you can also write you own file to load as an alternative
to adding data through the dialog. Data files have a simple format. They all begin with
'DrawForceFile' and then the units, either 'english' or 'metric'. Then pairs of
displacement and force numbers are given. Valid tokens (separators) are spaces, tabs,
or newlines. For example this is a valid data file:
| |
To make a graph based on the data, just hit the 'Generate' button. Most of the
information on the graph is modifiable through the menus. Double click on the title and
lables to change
them. Through the plot menu the visible graph can be changed to show the linear or cat-mull
interpolated line (smooth curve). The data points can be turned on and off as well.
Shifting the graph is accomplished by dragging the axes with the mouse, arrow keys
also work. The '+' and '-' keys zoom in and out, as does dragging a box around the portion
you wish to expand to fit the window. An easy way to return to the full view is to
turn on and off the curves, as the graph automatically changes to fit them.
Through the file menu, the
currently displayed view can be saved to disk as a png image.
Pretty simple. Hit the button. The area is calculated using the trapezoid method of integral approximation... which is the exact area under the linear interpolated curve. The S.E./P.D.F is a quality value of energy per unit of peak draw force.
wxWidgets: Cross platform toolkit for the window/control interface
wxDev-C++: IDE that I use with wxWidgets.