Readings
The Economist. "Census sensitivity: Numbers mean power, which is why counting people is so controversial."
Dec 19th 2007
OVERVIEW
When you are to gather or construct a data
table, there are several dimensions to consider:
1. time (single point in time, comparative statics, time-series)
2. space (geographic location: e.g., city, county,
MSA, state, country)
3. unit of analysis (e.g., person, household)
4. variables (e.g., annual income, age, occupation)
Also: what comparative cases (if any) will you use?
Some common data problems:
- What to do when the various variables are from different
years (e.g., population from 1990, but income from 1989, etc.)
- What to do with missing data.
- What to do with categories not adding to 100%. (rounding
error? missing data? double counting? e.g., with Hispanic wrongly added to
race.)
- How to deal with suppressed data.
- Interpolation and extrapolation.
Inductive (from observation
to theory) or deductive (from theory to observation)?
hypothetico-deductive: Know what you want before you hunt for data.
exploratory-inductive: But sometimes serendipity
leads to unexpected data.
Sample vs. Full Count (Census)
sample size - N
population size - M
sampling
fraction = N/M
normally we assume that N/M -> 0 (that is, one is sampling
a very small fraction of the population) Is this a problematic
assumption? see this brief example).
Data Sources (and Citations)
1. paper
2. electronic based on a paper published version
3. electronic with no paper published source
(also: data tapes)
Useful
Programs
1. Web browser (to view this document)
2. web page composer /html editor (to create this document)
3. A File Transfer Program old days: FTP (to download and
upload this page to my ifs space so that it is available on the web); now: use
SSH Secure Shell
(Windows) or Fugu
(Mac OS X).
4. Excel -- to analyze downloaded data (or use SPSS, SAS,
Systat, etc.)
5. Adobe Acrobat (to read formatted .pdf files)
Definitions
and Historical Context
Note the connections of statistics to statecraft
(common linguistic root) and to counting citizens, taxation, property.
census
OED, 2nd ed.
census se.nss, sb. [L. census registering of Roman citizens and
their property, registered property, wealth, f. censere to rate, assess, estimate.
]
1. The registration of citizens and their property in ancient
Rome for purposes of taxation.
2. Applied to certain taxes, esp. a capitation or poll-tax. Obs.
3.
a. An official enumeration of the population of a country or district,
with various statistics relating to them. Also attrib.
A census of the population has been taken every tenth year since
1790 in the United States of America, since 1791 in France, and since 1801 in
Great Britain. In Ireland the earliest census was in
1813, since which it has been taken simultaneously with that of Great Britain.
b. attrib., as in census return,
-table,
-taker; census-paper, a paper left at each house, to be filled
up with the names, ages, etc., of the inmates, and returned to the enumerators
on the day of taking the census.
-----
ENCYCLOPAEDIA BRITANNICA
http://www.britannica.com
census
an enumeration of people, houses, firms, or other important
items in a country or
region at a particular time. Used alone, the term usually refers to a
population
census--the type to be described in this article. However, many countries
take
censuses of housing, manufacturing, and agriculture.
-----
statistic
OED, 2nd ed.
statistic stati.stik, a. and sb. [ad. G. statistik sb. statistisch
adj., Fr. statistique adj. and fem. sb., ad. mod.L. statisticus, f. *statista
(Ital. statista) statist. Cf. Ital. statistico adj.,
statistica sb., Sp., Pg. estadÌstico adj., estadÌstica sb. The
earliest known occurrence of the word seems to be in the title of the satirical
work Microscopium Statisticum, by `Helenus Politanus', Frankfort
(?), 1672. Here the sense is prob. `pertaining to statists or to statecraft'
(cf. statistical a. 1). The earliest use of the adj. in anything resembling
its present meaning is found in mod.L. statisticum collegium,
said to have been used by Martin Schmeizel (professor at Jena, died 1747) for
a course of lectures on the constitutions, resources, and policy of the various
States of the world. The G. statistik was used as a name
for this department of knowledge by G. Achenwall in his Vorbereitung zur Staatswissenschaft
(1748); the context shows that he did not regard the term as
novel. The Fr. statistique sb. is cited by LittrÈ from Bachaumont (died
1771); Fr. writers of the 18th c. refer to Achenwall as having brought the word
into use. The sense-development of the word may have been
influenced by the notion that it was a direct derivative of L; status state
sb. ]
B. sb.
1.
a. = statistics 1. rare.
b. A quantitative fact or statement.
c. Statistics. Any of the numerical characteristics of a sample
(as opposed to one of the population from which it is drawn). Cf. parameter
2 f.
2. = statistician.
-------
sample
OED, 2nd ed.
sample s.mp'l, , sb. Forms: 4 sampel, saumpel, -pul, -ple, saunpil,
4-5 saumpil, 4-6 sampill, saumple, 5 sampil(le, sampull, saumpyl, 4- sample.
[ME. sample, aphetic f. essample: see
example sb. ]
1. A fact, incident, story, or suppositious case, which serves
to illustrate, confirm, or render credible some proposition or statement. (Cf.
example sb. 1.) Obs.
2.
a. A relatively small quantity of material, or an individual object,
from which the quality of the mass, group, species, etc. which it represents
may be inferred; a specimen. Now chiefly Comm., a
small quantity of some commodity, presented or shown to customers as a specimen
of the goods offered for sale. (An individual article offered as a specimen
of goods sold by number and not by
weight or measure is now more commonly called a pattern.)
b. of immaterial things.
c. A specimen taken for scientific testing or analysis.
d. Statistics. A portion drawn from a population, the study of
which is intended to lead to statistical estimates of the attributes of the
whole population.
The U.S. Census
The term "census" has at least three common
uses:
1. as a type of count: a
full count (at least in theory) rather than a sample
2. as a data set: the
actual count of the U.S. population every ten years. Hence Decennial
censuses (every 10 years - 1980, 1990, 2000, etc.)
3. as a government agency:
the government agency that administers this count (the Bureau of the Census,
which is under the Department of Commerce). Note: the decennial
census is but one of MANY sets of data that the agency collects.
The U.S. Constitution provides for a census of the population
every 10 years, primarily to establish a basis for apportionment of members
of the House of Representatives among the States. For over a century after the
first census in 1790, the census organization was a temporary one, created only
for each decennial census. In 1902, the Bureau of the Census was established
as a permanent Federal agency, responsible for enumerating the population and
also for compiling statistics on other subjects. Historically the census
of population has been a complete count. That is, an attempt is made to
account for every person, for each person's residence, and for other characteristics
(sex, age, family relationships, etc.). Since the 1940 census, in addition to
the complete count information, some data have been obtained from representative
samples of the population. In the 1990 census, variable sampling rates were
employed. For most of the country, 1 in every 6 households (about 17
percent) received the long form or sample questionnaire; in governmental
units estimated to have fewer than 2,500 inhabitants, every other household
(50 percent) received the sample questionnaire to enhance the reliability of
sample data for small areas. Exact agreement is not to be expected between sample
data and the complete census count. Sample data may be used with confidence
where large numbers are involved and assumed to indicate trends and relationships
where small numbers are involved.
Census data presented here have not been adjusted for underenumeration.
Results from the evaluation program for the 1990 census indicate that the
overall national undercount was between 1 and 2 percent the estimate from
the Post Enumeration Survey (PES) was 1.6 percent and the estimate from Demographic
Analysis (DA) was 1.8 percent. Both the PES and DA estimates show disproportionately
high undercounts for some demographic groups. For example, the PES estimates
of percent net undercount for Blacks (4.4 percent), Hispanics (5.0 percent),
and American Indians (4.5 percent) were higher than the estimated undercount
of nonHispanic whites (0.7 percent). Historical DA estimates demonstrate that
the overall undercount rate in the census has declined significantly over the
past 50 years (from an estimated 5.4 percent in 1940 to 1.8 percent in 1990),
yet the undercount of Blacks has remained disproportionately high.
link: The
2000 U.S. Census
Where is each person counted?
( US Census language reproduced below with web sources ...)
| 2000 |
1990 |
| The
2000 Census Residence Rules
"Planners of the first U.S. decennial census in 1790
established the concept of "usual residence" as the main principle in
determining where people were to be counted. This concept has been followed
in all subsequent censuses and is the guiding principle for Census 2000.
Usual residence has been defined as the place where the person lives and
sleeps most of the time. This place is not necessarily the same as the
person's voting residence or legal residence. Also, noncitizens who are
living in the United States are included, regardless of their immigration
status."
FOREIGN
CITIZENS
"Citizens of foreign countries who have established
a household or are part of an established household in the U.S. while
working or studying, including family members with them - Counted at the
household. Citizens of foreign countries who are living in the U.S. at
embassies, ministries, legations, or consulates - Counted at the embassy,
etc. Citizens of foreign countries temporarily traveling or visiting in
the U.S. - Not included in the census."
STUDENTS
Boarding school students - Counted at their parental home
rather than at the boarding school.
College students living away from home while attending
college - Counted where they are living at college.
College students living at their parental home while attending
college - Counted at their parental home. |
For the 1990 Census:
"Each person included in the census was to be counted at his or her
usual residence--the place where he or she lives and sleeps
most of the time or the place where the person considers
to be his or her usual home. If a person had no usual
residence, the person was to be counted where he or
she was staying on April 1, 1990.
Persons temporarily away from their usual residence,
whether in the United States or overseas, on a vacation
or on a business trip, were counted at their usual
residence. Persons who occupied more than one residence
during the year were counted at the one they considered to be their
usual residence. Persons who moved on or near Census Day were counted
at the place they considered to be their usual residence."
How about students?
"Persons Away at School-- College students were counted as
residents of the area in which they were living while
attending college, as they have been since the 1950 census.
Children in boarding schools below the college level were counted
at their parental home"
source: Population and Housing Unit Counts, Selected Appendixes: 2000 |
Two Types of Census Forms
| questionnaire
type |
who received the questionnaire |
2000 - Format of Compiled Census Data (Summary
File) |
1990 - Format of Compiled Census Data (Summary Tape
File) |
| long
form |
a sample (either 1/6 or 1/2 or
1/8 of hhds. receive this form, depending on population size of location):
overall: 1-in-6. see documentation
on sampling rates. |
SF3 |
STF3 |
| short
form |
full count (every hhd. receives this
form) |
SF1 |
STF1 |
In between the 10 Year Census -- How are population estimates made?
Current Population Survey (CPS)
This is a monthly nationwide survey of a scientifically selected sample representing
the noninstitutional civilian population. The sample is located in 754 areas
comprising 2,121 counties, independent cities, and minor civil divisions with
coverage in every State and the District of Columbia and is subject to sampling
error. At the present time, about 50,000 occupied households are eligible for
interview every month; of these between 4 and 5 percent are, for various reasons,
unavailable for interview.
While the primary purpose of the CPS is to obtain monthly statistics
on the labor force, it also serves as a vehicle for inquiries on other subjects.
Using CPS data, the Bureau issues a series of publications under the general
title of Current Population Reports, which cover population characteristics
(P20), consumer income (P60), special studies (P23), and other topics.
Some definitions
Urban and rural÷
According
to the 1990 census definition, the urban population comprises all persons living
in (a) places of 2,500 or more inhabitants incorporated as cities, villages, boroughs
(except in Alaska and New York), and towns (except in the New England States,
New York, and Wisconsin), but excluding those persons living in the rural portions
of extended cities (places with low population density in one or more large parts
of their area); (b) census designated places (previously termed unincorporated)
of 2,500 or more inhabitants; and (c) other territory, urban constitutes the rural
population
Residence÷In
determining residence, the Bureau of the Census counts each person as an inhabitant
of a usual place of residence (i.e., the place where one usually lives and sleeps).
While this place is not necessarily a person's legal residence or voting residence,
the use of these different bases of classification would produce the same results
in the vast majority of cases.
Race÷The
Bureau of the Census collects and publishes racial statistics as outlined in Statistical
Policy Directive No. 15 issued by the U.S. Office of Management and Budget. This
directive provides standards on ethnic and racial categories for statistical reporting
to be used by all Federal agencies. According to the directive, the basic racial
categories are American Indian or Alaska Native, Asian or Pacific Islander, Black,
and White. (The directive identifies Hispanic origin as an ethnicity.) The concept
of race the Bureau of the Census uses reflects self identification by respondents;
that is the individual's perception of his/her racial identity. The concept is
not intended to reflect any biological or anthropological definition. Although
the Bureau of the Census adheres to the overall guidelines of Directive No. 15,
it recognizes that there are persons who do not identify with a specific racial
group. The 1990 census race question includes an "Other race" category with provisions
for a write in entry. Furthermore, the Bureau of the Census recognizes that the
categories of the race item include both racial and national origin or sociocultural
groups. Differences between the 1990 census and earlier censuses affect the comparability
of data for certain racial groups and American Indian tribes. The lack of comparability
is due to changes in the way some respondents reported their race as well as changes
in 1990 census procedures related to the racial classification. (For a fuller
explanation, see 1990 Census of Population, Volume I,
Hispanic (many be of any
racial category - so don't add with racial categories, since it cuts across
racial categories)
see US
Census definition
Census
Geography
A
Hierarchy of Census Areas (from the 1990 Census): from BIG to small
see a pdf
version of this hierarchy
| 1 |
Nation (US) |
| 4 |
Regions (e.g., Midwest) |
| 9 |
Divisions (e.g., East North
Central) |
| 57 |
States and Statistically
Equivalent Entities (e.g., Michigan) |
| 3,248 |
Counties and Statistically
Equivalent Entities (e.g., Washtenaw) |
| 60,228 |
County Subdivisions and Places
(e.g., Ann Arbor) |
| 576 |
American Indian and Alaska Native
Areas |
| 62,276 |
Census Tracts and Block Numbering
Areas (BNAs) |
| 229,192 |
Block Groups (BGs) |
| 7,017,427 |
Blocks |
What are blocks?
"Census blocks are small areas bounded on all sides by visible
features such as streets, roads, streams, and railroad tracks, and by
invisible boundaries such as city, town, township, and county limits,
property lines, and short, imaginary extensions of streets and roads.
source: technical
documentation
Metropolitan Areas
Overview: The US government developed standard definitions of metropolitan areas in the 1940s [source]. These definitions have changed over time, reflecting both changes in the structure of US metropolitan areas and changes in our understanding of metropolitan geography.
Metropolitan
Areas: Detroit
as an example
A Map of Lower Michigan Counties
Overview: 
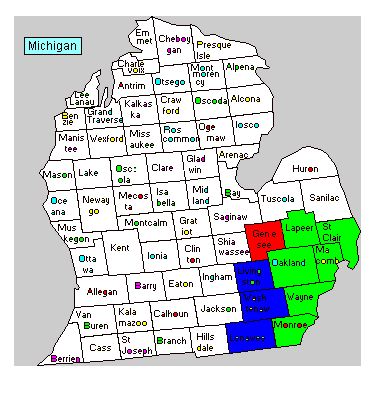 |
35
Detroit-Ann Arbor-Flint, MI CMSA
35 0440
Ann Arbor, MI PMSA
35 0440 26091
Lenawee County
35 0440 26093
Livingston County
35 0440 26161
Washtenaw County
35 2160
Detroit, MI PMSA
35 2160 26087
Lapeer County
35 2160 26099
Macomb County
35 2160 26115
Monroe County
35 2160 26125
Oakland County
35 2160 26147
St. Clair County
35 2160 26163
Wayne County
35 2640
Flint, MI PMSA
35 2640 26049
Genesee County |
Population in the Detroit-Ann Arbor-Flint,MI CMSA and its
three component MSAs,
1980 - 1994 (in thousands)
| METROPOLITAN AREA |
1980 |
1990 |
1991 |
1992 |
1993 |
1994 |
1980-90 |
1990-94 |
| Detroit-Ann Arbor-Flint,MI CMSA |
5,293 |
5,187 |
5,215 |
5,236 |
5,246 |
5,256 |
-2.0 |
1.3 |
| Ann Arbor,
MI PMSA |
455 |
490 |
498 |
504 |
509 |
515 |
7.7 |
5.1 |
| Detroit,
MI PMSA |
4,388 |
4,267 |
4,285 |
4,299 |
4,304 |
4,307 |
-2.8 |
0.9 |
| Flint,
MI PMSA |
450 |
430 |
432 |
432 |
433 |
433 |
-4.4 |
0.7 |
GUIDE TO FIPS CODES:
(Note: FIPS = Federal Information Processing Standards) see
this resource
MSA= Metropolitan Statistical Area
CMSA= Consolidated Metropolitan Statistical Area
PMSA= Primary Metropolitan Statistical Area
SS= State
CCC= County
PPPPP= Place (city/town)
| Type of Metropolitan Area |
|
Number |
Example |
| MSA (metropolitan statistical
area) |
stand alone metro area (a county
or counties) |
268 |
(e.g., Lansing-East Lansing, MI
MSA) |
| CMSA (consolidated MSA) |
a very large metro area, consisting
of a collection of PMSAs |
21 |
(e.g., Detroit-Ann Arbor-Flint,
MI CMSA) |
| PMSA (primary MSA) |
a subset of CMSAs |
73 |
(e.g., Ann Arbor, MI PMSA) |
New York CMSA has 15 PMSAs
LA CMSA has four (albeit big ones)
Detroit CMSA has three: Ann Arbor, Detroit,
and Flint.
MA (Metropolitan Area) The MA classification is a statistical
standard developed for use by Federal agencies in the production, analysis,
and publication of data on MAs. The MAs are designated by the Office of Management
and Budget. Metropolitan Areas can be classified as a Metropolitan Statistical
Area (MSA) or as a Consolidated Metropolitan Statistical Area (CMSA), that is
a MA divided into Primary Metropolitan Statistical Areas (PMSAs.) See also MSA/CMSA/PMSA.
More detailed definitions:
PMSA (Primary Metropolitan Statistical Area) An area
defined by the Office of Management and Budget as a Federal statistical standard,
comprised of one or more counties (county subdivisions in New England), within
a metropolitan area, having a population of 1,000,000 or more. When PMSAs are
established, the larger area of which they are component parts is designated
a Consolidated Metropolitan Statistical Area.
CMSA (Consolidated Metropolitan Statistical Area) An
area defined by the Office of Management and Budget as a Federal statistical
standard. In metropolitan areas where Primary Metropolitan Statistical Areas
(PMSAs) are defined, the larger area of which the PMSAs are components is designated
a CMSA.
MSA (Metropolitan Statistical Area) An area defined by
the Office of Management and Budget as a Federal statistical standard. An area
qualifies for recognition as an MSA if it includes a city of at least 50,000
population or an urbanized area of at least 50,000 with a total metropolitan
area population of at least 100,000. See also (MA).
NECMA (New England County Metropolitan Area) A county-based
equivalent to the official metropolitan areas in the six New England States,
where the standard components are county subdivisions (cities and towns) instead
of counties as in other states.
For descriptive details and a listing of titles
and components of MA's, see Appendix II.
Metropolitan Areas (MA's)
The general concept of a metropolitan area is one of a core area containing
a large population nucleus, together with adjacent communities that have a high
degree of social and economic integration with that core.
Metropolitan statistical areas (MSA's),
consolidated metropolitan statistical areas (CMSA's),
and primary metropolitan statistical areas (PMSA's)
are defined by the Office of Management and Budget (OMB) as
a standard for Federal agencies in the preparation and publication of statistics
relating to metropolitan areas.
The entire territory of the United States is classified as metropolitan
(inside MSA's or CMSA' -- PMSA's are components of CMSA's) or nonmetropolitan
(outside MSA's or CMSA's).
MSA's, CMSA's, and PMSA's are defined in terms of entire counties
except in New England, where the definitions are in terms of cities and towns.
The OMB also defines New England County Metropolitan Areas (NECMA's) which are
county-based alternatives to the MSA's and CMSA's in the six New England States.
From time to time, new MA's are created and the boundaries of others change.
As a result, data for MA's over time may not be comparable and the analysis
of historical trends must be made cautiously. For descriptive details and a
listing of titles and components of MA's, see Appendix II.
Also, New England has NECMAs: New England county MA. Place and
county alternatives to the standard MAs

How to access the 2000 Census Data:
for an overview, see Comparison
of 2000 Census Delivery Vehicles, UM Documents Center
several options:
A few questions:
- How did the Census handle non-English
speakers? The Census did provide Census forms in languages
other than English. Please see this link.
- How were migrants from Puerto
Rico to the 50 US States classified? As "native"
but "born outside the United States". There are two broad categories:
"Native" and "Foreign Born". "Native"
is divided into "born in the United States" and "born outside
the United States" (the latter including "Puerto Rico", "US
island Areas" and "Born abroad of American Parents"). "Foreign
born" is divided into "Naturalized citizen" and "Not
a citizen".
- Where are citizens living abroad
counted? It depends on employment status and whether you are
in the military or not. For a detailed discussion, see "Residence
Rules" for the 2000 Census. To quote this source:
"U.S. CITIZENS ABROAD
U.S. citizens employed overseas as civilians by the U.S. Government, including
family members with them - Counted as part of the U.S. overseas population
and not as part of the U.S. resident population.
U.S. citizens not employed by the U.S. Government who are working, studying,
or living overseas - Not included in the census."
(Source: U.S. Census Bureau, Population Division, Population & Housing Programs
Branch Maintained By: Laura K. Yax (Population Division) Created: August 9,
1999 Last Revised: September 13, 2002 at 07:24:37 AM)
Different
ways to download data -- i.e., how do you get data you see on the screen into
an Excel Spreadsheet?
You may often find interesting data on the web and want to import
into an Excel file. This process, depending on the format of the source data,
might be either easy or complicated.
Ordered roughly from easy to difficult:
| FORMAT OF SOURCE DATA |
How to convert into an Excel File |
| Excel file |
1. If you are lucky, the data is already in Excel
format. Simply download the file to your machine. |
| tab-, comma, or space-delimited
(e.g., in a Word or text file). |
2. If the data is in a text or word format (etc.), and the data columns
(variables) are delimited (separated) by tabs, commas (csv), spaces,
etc., then open the text file in Excel. Excel's (Text Import Wizard) will
then prompt you for the data format: select delimited and
then what character(s) delimit (i.e., separate) the data columns. This should
result in a usable Excel file. |
| fixed width |
3. If the data is organized with each variable in a fixed column (e.g.,
city code in columns 1-3, year in columns 4-7, etc.) then open the text
file in Excel. Excel's (Text Import Wizard) will then prompt you for the
data format: select fixed-width and then insert vertical
break lines between the variables. This should result in a usable Excel
file. |
| html file |
4. If you are lucky, the creator of the web page organized the data using
tables (note: this section of this web page itself is formatted as a table).
You should hopefully be able to simply copy and paste the table into a blank
Excel worksheet, with the table organization (in rows and columns) retained.
If the data is NOT organized by tables, copy-and-paste results may be unpredictable. |
| .pdf file |
5. PDF to Excel -- this one is not so straightforward, since pdf files
are formatted for easy, standardized printing but NOT for easy data transfer,
so getting data from a pdf file is sometimes an adventure. Here are a
few methods. Try the one that works best (and that matches your source
data format). In general order of preference:
a. Double-check to see whether the data set is available in another
format other than pdf (such as Excel, tab or comma or space-delimited;
etc.). You might even contact the source to see what they say.
b. Use the "select Table Tool" in Adobe Acrobat (note: this
is NOT in Adobe Acrobat Reader, but in the more powerful program Adobe
Acrobat). Use this tool to select the table (or a subset of the table),
and then either directly copy-and-paste into Excel or create a text
file as an intermediary, and then open this text file with Excel, which
should prompt the "Text Import Wizard" within Excel. Important:
sometimes it may be more effective to break the process of
copying and pasting into several subsections: e.g., copy and paste,
in separate steps: the title, the data columns with text, the data columns
with numerical values, and then finally the footnotes/sources. (You
may need to experiment to see what works best.) See this useful guide:
EXPORTING
PDF FILE TABLES TO EXCEL SPREADSHEETS (from the TriUniversity Data
Resources). Or use this google
search to find similar pages.
c. Use MS Word (or another text editing program) as a stepping stone
between pdf and Excel. Copy the relevant part of the pdf file, pasting
into MS Word (or another text editing program), and then viewing the
resulting text. Convert text to Courier (or another equal spacing font)
to better see the data table structure. Make invisible elements visible
(e.g., tabs, spaces, paragraph returns). Then do some global "find
and replace" to clean up the table. The goal is a file with tabs
(^t) separating each column, and paragraph returns (^p) separating each
line (i.e., case). Watch out for extra tabs (e.g., multiple tabs between
columns should be converted to single tabs), otherwise your table columns
will be misaligned.
d. You can have the professionals
do it (try this google
search for some options). You might also look at the
File Format and Data Conversion Site.
|
| bitmap (image) file |
6. Here the numbers and text of the data table are in an image file, and one cannot directly copy and paste into Excel -- since the alphanumeric characters are simply images, not characters. You might try "optical character recognition" (OCR) software, which translates images into machine-readable text. Wikipedia has a list of OCR software. Adobe Acrobat can do OCR: look in "Document" > "Paper Capture". (Note: Adobe cannot handle all types of images; images should be clean; and scanned images should be 200 - 600 dpi for B&W and 200 - 400 dpi for grayscale or color.). Once you convert the image file, you will need to check for errors in the conversion. Then you will need to get the file into a format that Excel will be able to read accurately (see 5b and 5c above). |
see also this Excel
Tutorial
UP504 Practice Exercise -- "Data
Scavenger Hunt"
In preparation for class, I would encourage you to attempt the following
data tasks. This should make the topics more relevant. Consider
this a kind of data "scavenger hunt".Note: some of these tasks are
easier than others. You do NOT need to turn these answers in, but bring
your any answers in to class for discussion.
[Hint: for Questions 1-4, think about whether the data is from the Census short
form or long form]
----
TASKS (easier ones first):
1. find (from US Census 2000) the number of people living is:
a. the NEW York CMSA
b. the New York PMSA
c. New York City
d. the zip code area containing the former World Trade Center (in Lower Manhattan)
2. Download the above data into Excel.
3. Using the same geographic categories from above (a,b,c,d), find the values
for this variable:
- QT-H11: Vehicles Available (2000) and Household Income in 1999
4. Using the American
Factfinder, generate a thematic map of:
Mean Travel time to work (2000) for
(a) the US by county
(b) for the New York CMSA by county subdivision
(NOTE: you might experiment with changing data boundaries and features]
5. Downloading data from a .pdf file (this is a tricky one, but do give it
a try! see the above discussion of downloading into Excel)
Access the online version of the State and Metropolitan Area Data Book: 2006
http://www.census.gov/prod/www/abs/smadb.htm
Find this table:
Table C-1. Metropolitan Areas With Component Counties — Population and Population
Characteristics
Your task: download the data for the Detroit-Warren-Livonia, MI MSA (download page 193, including -- the column headings with variable names/labels)
(Note: pdf files are formatted for easy, standardized printing but NOT for easy
data transfer, so getting data from a pdf file can be an adventure...)
Other
Resources / Sources of Data
| |

