| WEEK 9
Conceptual Material and Application
Mapping Concepts, Classical and
Contemporary
-
Classical map projections
-
Lat/long--blackboard example
-
one-point
compactification--reference to Week 2 lecture--blackboard
example
-
classification
-
ArcView:
-
illustration using software
(extra extensions which
may or may not be useful--disable virus checking software first).
Canada maps--variety of projections, including orthographic for
animated
globes.
-
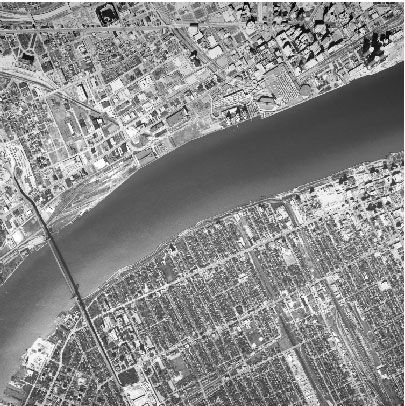
Image to map transformer
utility: http://www.co.seminole.fl.us/growth/gis/extents.htm
permits the relatively easy insertion of a raster image behind a vector
image (as in, for example, an aerial photo behind a GIS map). Sample
raster image.
-
raster--grid locations--all
values in a pixel assigned
same numerical value
-
vector--point locations--each
point has a unique
location.
-
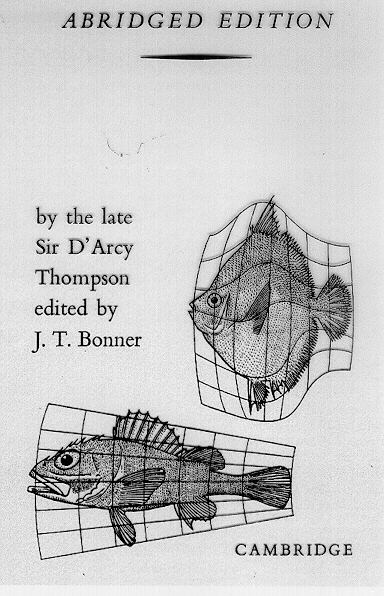
Classical transformation--from Thompson
to Tobler
-
Chaos--different views -- a parabola
and y=x--quadratic
and linear system
-
simple dynamical system--seeking
stability--blackboard
examples
-
complex dynamical system--not
seeking stability--blackboard
examples
-
suggestion of intervention
opportunities
-
Applets
-
Notes about thematic maps
-
When you have a range of data, use a
range of color
to match the data: an increase in numerical value in the database
should correspond to an evident color increase--from pink to rose to
magenta
to red to burgundy--not from pink to orange to burgundy to yellow to
chartreuse.
-
When you are partitioning a range of
data, explain
how you treat gaps.
-
When comparing one thematic map to
another, standardize
the data partitioning procedure; if you also have another series in
which
standarization is not evident, explain.
-
Think about how you choose to
partition data and
explain why one choice is better than another, for your purposes.
Map your data using more than one data partitioning scheme--it can give
insight into how others might choose to view your data.
-
You might want to save your legend as
a .avl file
(and remember to move it with the map).
References:
John P. Snyder, Flattening
the Earth: Two Thousand Years of Map Projections, University
of Chicago Press, 1993.
D'Arcy W.
Thompson, On
Growth and Form, Cambridge University Press.
Waldo R. Tobler,
Map Transformation
of Geographic Space. Ph.D. dissertation University of
Washington.
Feigenbaum,
Mitchell J.
Universal behavior in non-linear systems. Los Alamos Science,
summer, 4 - 27.
Gleick, J.
1987. Chaos:
Making A New Science. New York: Penguin Books.
Hofstadter, D.
R. 1981.
Strange attractors: Mathematical patterns delicately poised
between
order and chaos. Scientific American November:
23-43.
Sandra L.
Arlinghaus,
John D. Nystuen and Michael J. Woldenberg. "An application of graphical
analysis to semidesert soils." Geographical Review. New
York:
The American Geographical Society. July, 1992, pp.244-252.
|