Engineering
477
Fall, 2005
Links to Engineering 477 home page
and to the 3D Laboratory of the Duderstadt Center:
http://www-vrl.umich.edu/Eng477/
http://um3d.dc.umich.edu/
Downtown Ann Arbor Models
Faculty Team:
Sandra L. Arlinghaus, Ph.D.
Adj. Prof. of Mathematical Geography and
Population-Environment Dynamics, SNRE
Matthew Naud, M.S., M.P.P.
Environmental Coordinator, City of Ann
Arbor
Paul Lippens, M.U.P.
Intern, Systems Planning Unit, City of
Ann Arbor
Braxton Blake, Ph.D.
Composer and Conductor (Stuttgart Symphony
Orchestra and various others).
|
Related
Links
Previous
work, coupled using kiosks to move from one scale to another.
Look at the "Archive," too. Note links on buildings and on kiosks
within the associated vrml files. There are links throughout to work
done by students in previous years and to work done by various professional
colleagues.
Clickable
maps display large amounts of information quickly and easily.
Interactive
map showing downtown area.
Interactive
map showing parcels in Allen Creek floodplain and floodway.
Virtual
London: similar strategies employed in London and in Ann Arbor.
Web
presentation from City Hall on flooding concerns.
Minutes
from a Downtown Residential Taskforce meeting. |
GLOBAL FLOOD SCENARIO:
MODEL GENERALITY
The Argo Dam holds back
the Huron River, just to the west of downtown, forming Barton Pond.
Allen Creek enters the Huron River just to the east of the Argo Dam.
What would be the impact of a sudden disaster at Argo Dam on the homes
and businesses in the Allen Creek floodplain? How might one model
such a scene?
The City of Ann Arbor
already has a substantial amount of data in its technological base.
Much of it can be analyzed using GIS (Geographic Information Systems) software.
Questions such as how many homes lie in the floodplain, which parcels have
their centroid in the floodplain, and numerous other questions linking
databases to maps can be answered. Also, clickable maps may answer
related questions in planning for evacuation or analysis following an emergency.
Beyond these maps, however, much more can come through virtual reality
models. The images below show some maps made in the GIS; all are
2D maps although some show buildings extruded from digitized footprints
of aerials as 3D suggestions.
Buildings in relation to the Allen Creek floodplain.
Buildings are extruded in relation to underlying elevation, as are streets
and hydro features. |
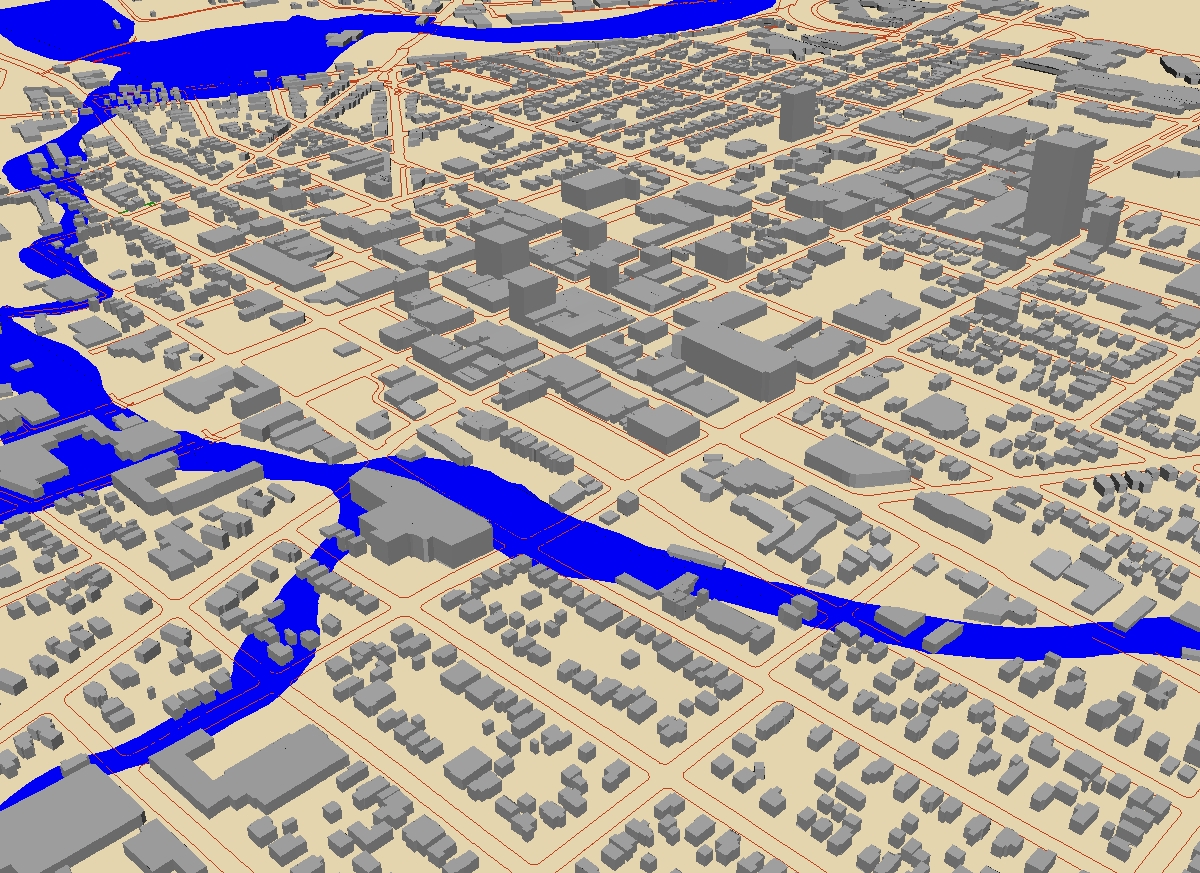
Buildings in relation to the Allen Creek Floodway.
Buildings are extruded in relation to underlying elevation, as are streets
and hydro features. |
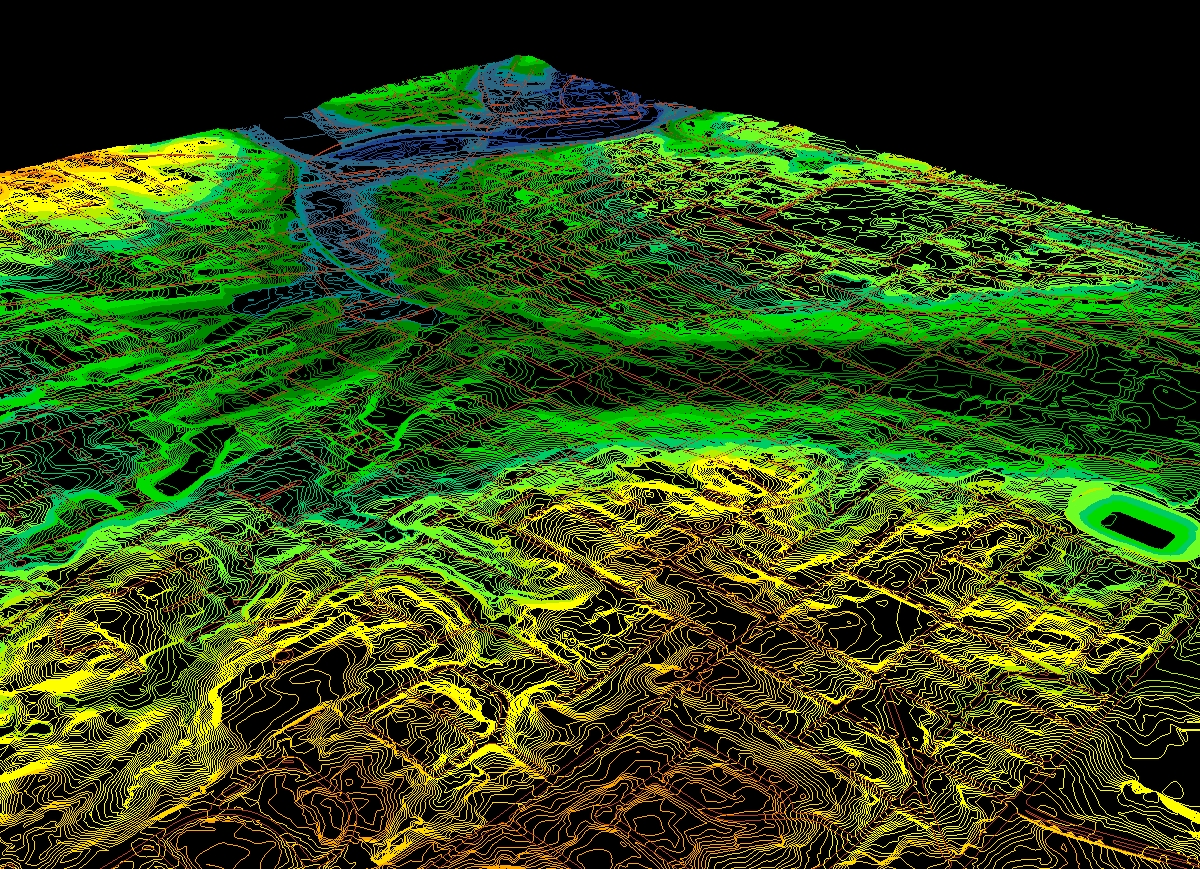
Contours, Allen Creek, 1 foot contour interval
(spacing in elevation between successive contours). Contours are
extruded in relation to underlying elevation, as are streets. |

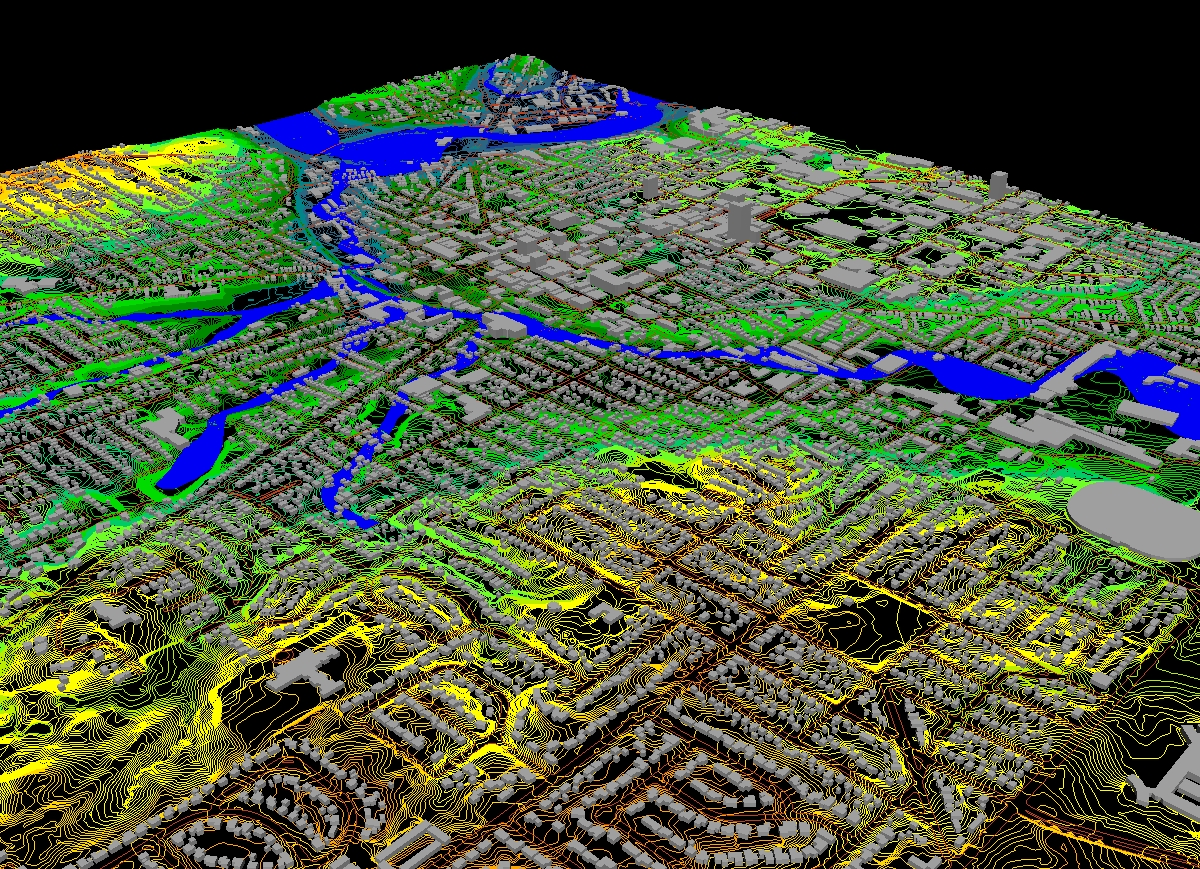
Contours and buildings, Allen Creek.
Buildings and other features are extruded in relation to underlying elevation. |
Contours, buildings, and floodway, Allen Creek.
Buildings and other features are extruded in relation to underlying elevation. |
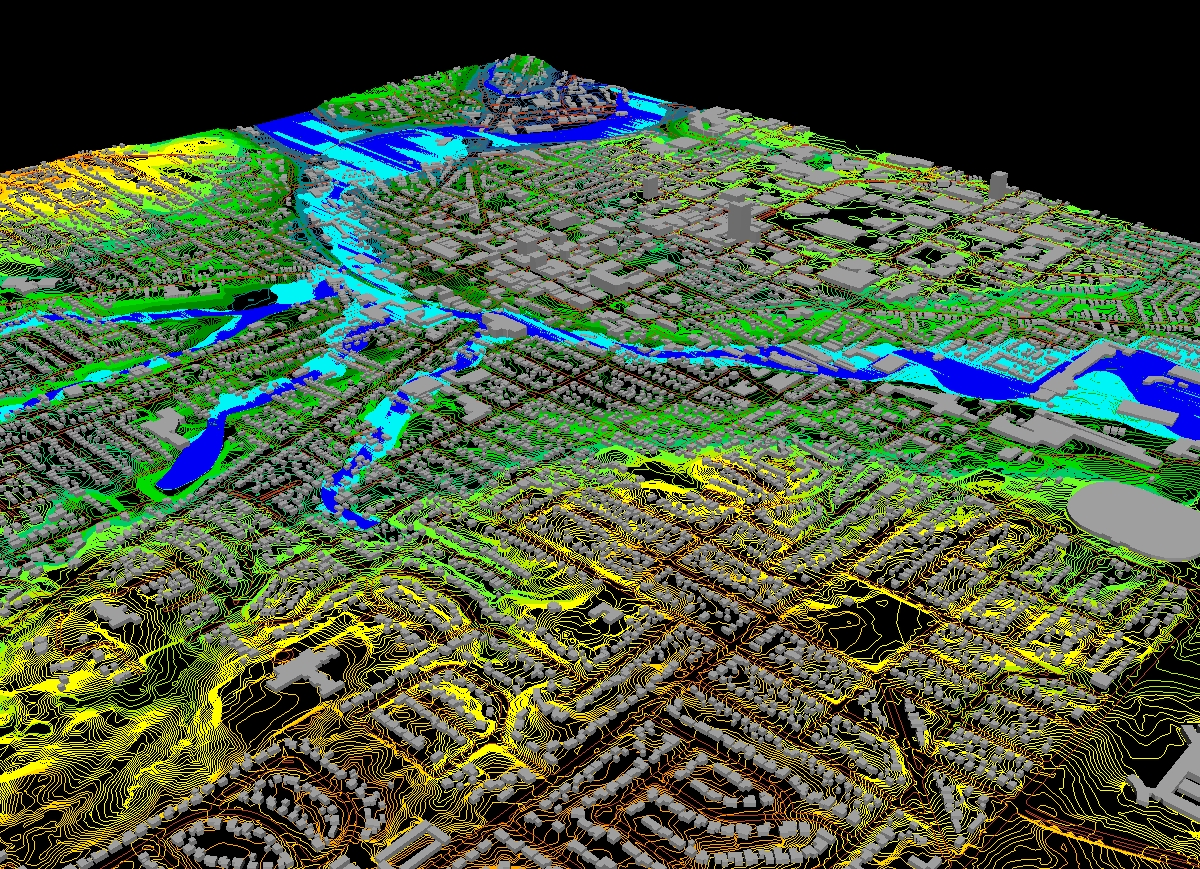
Contours, buildings, floodway, and floodplain,
Allen Creek. Note coplanar polygons interfering with distinction
between floodway and floodplain. Buildings and other features are
extruded in relation to underlying elevation. The problems associated
with coplanar polygons are not unique to virtual reality models! |
Triangulated Irregular Network (TIN), formed
from 1 foot contours, in the GIS (a specific tesselation strategy).
These files typically have far to many triangles to be useful for broad
studies portrayed on average equipment. The level of detail in the
TIN matches the level of detail in the contour files (note the street outlines
and related features). On a fine machine, this TIN can be converted
to a 3D file which can then be exported to vrml 2.0. |
Files are exported from the
GIS to vrml and these can then be used as geometry for use directly in
VRML Pad on in 3D-SMax. All such files are available for team use,
by students and faculty advisors. The direct export feature from
the GIS produces vrml files that are unwieldy in size. Thus, one
challenge is to take the basic geometry and manipulate it so that it will
render well. One solution, employed previously, has been to link
detailed studies to global studies so that a click in Cosmo Player takes
the viewer to a more detailed model.
The image below shows
a close up of the figure with buildings extruded in relation to the TIN
(in previous files, buildings were always extruded in relation to the TIN,
but the TIN generally was not shown to reduce file size). With
a very local study, it is possible to show the TIN, as well. Click
on the image below to launch the associated vrml file derived directly
from the GIS. Notice that viewpoints will need to be set: the
view within the GIS was attractive but when the file was converted to vrml,
that view was lost. The sun was set at low in the southeast,
within the GIS. No vertical exaggeration was calculated within the
GIS (although it can be done). To keep everything working smoothly,
it is often easiest simply to use the GIS file as a way to introduce information
into 3D Studio Max and extrude buildings as boxes in relation to contours.
Then, perhaps, make an elevation grid in 3D Studio Max from the contours
rather than trying to incorporate the TIN directly into the vrml file.
This VR is composed of a number of inline files: these are attached
in the subdirectory associated with this link
(take a look to see the complexity...open them in Notepad or VRMLpad).
Imagine then, clicking
on a link in a broad scale map to see virtual models of associated street
intersections or blocks. Then, imagine clicking on buildings in the
vrml file to "look inside" the buildings. Keep that in mind when
considering the section below.
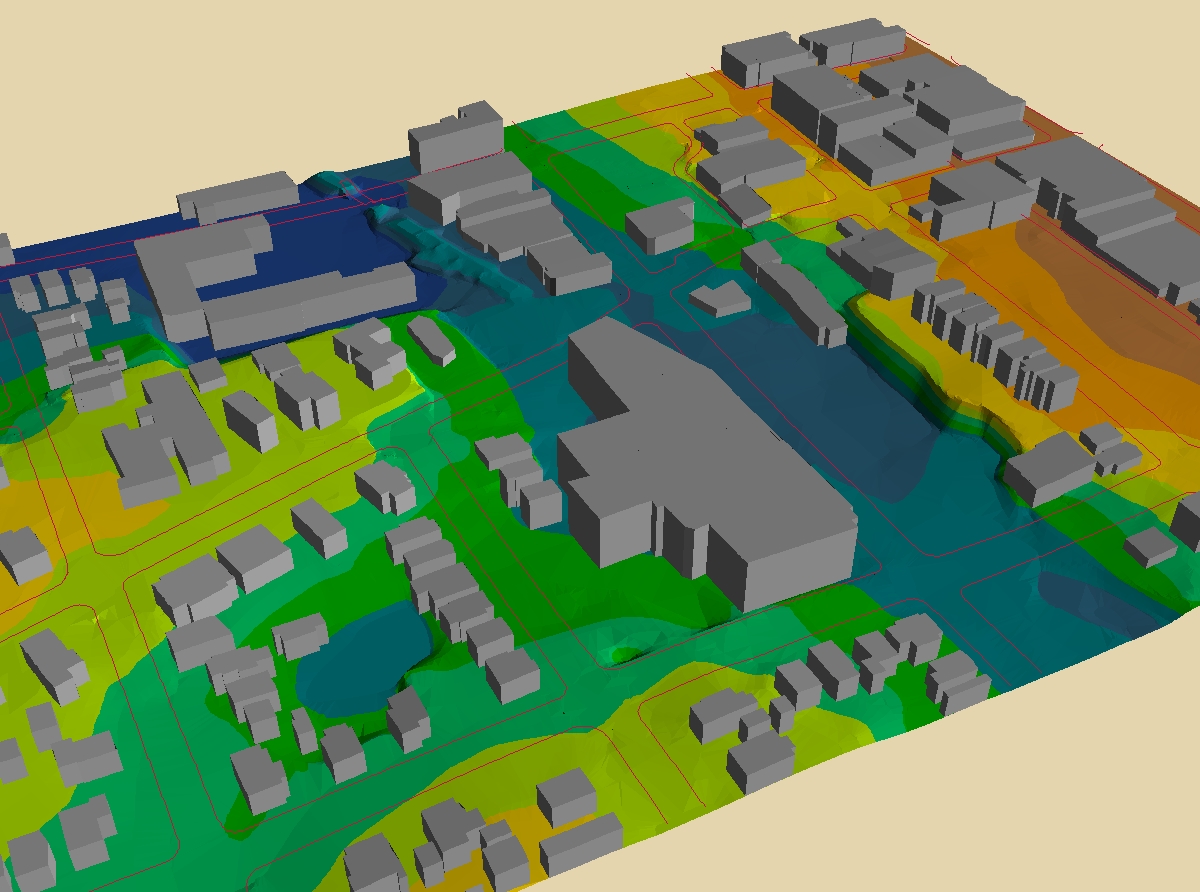
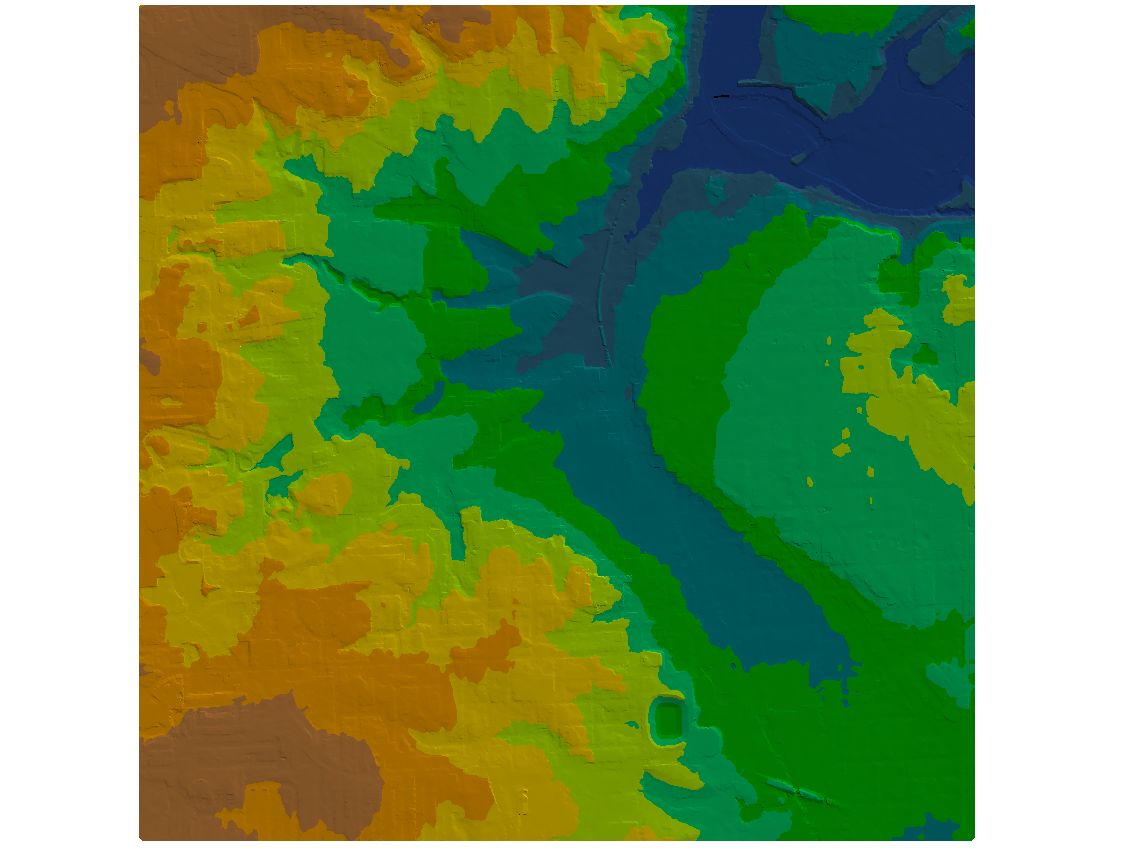
LOCAL FLOOD SCENARIO:
MODEL DETAIL
Consider the impact that
Liberty Street has on possible flood scenarios: Liberty, itself,
serves as a dam in the event of a surge up the Allen's Creek.
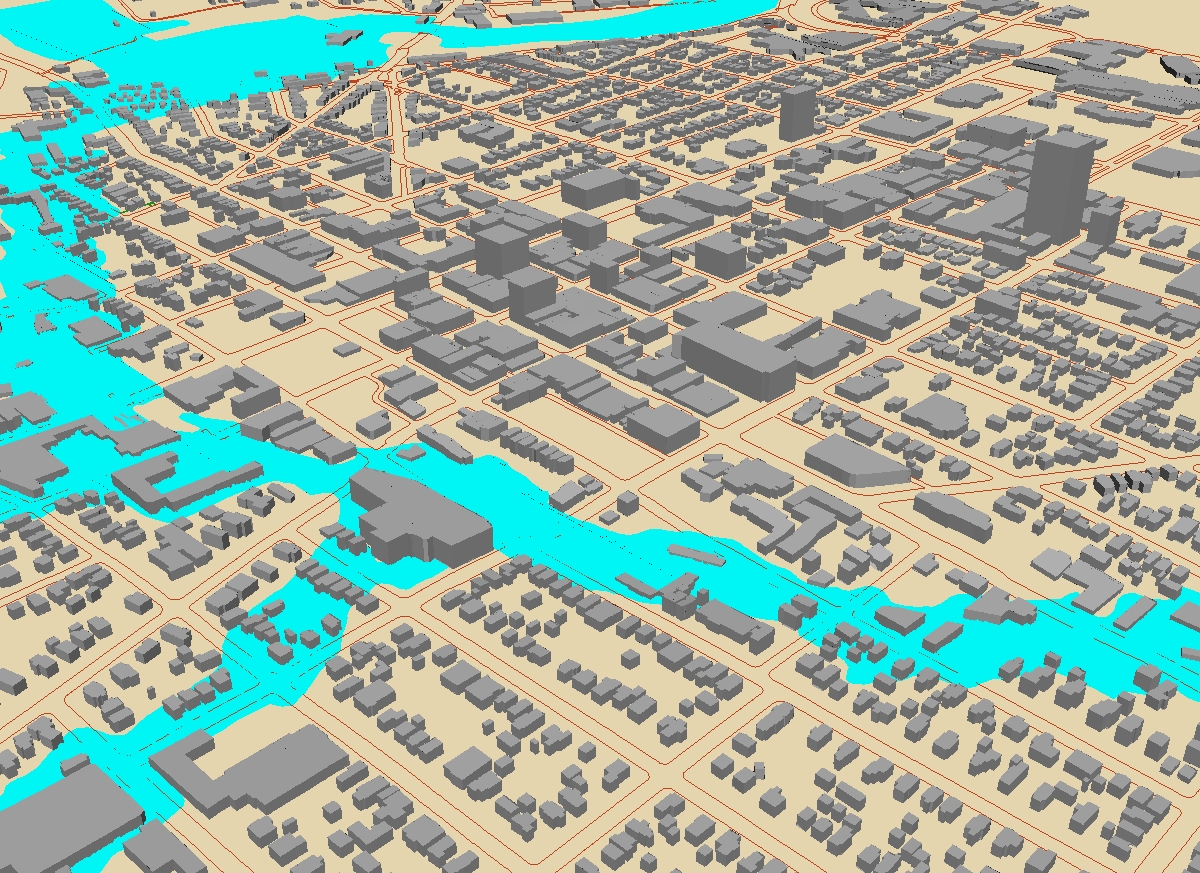
In the map below, the Allen Creek "floodway" (the channel that holds the
creek, underground much of the way, but it's still there) is shaded in
cyan diagonal stripes. The Allen Creek "floodplain" (the area that
catches the overflow in the time of flood, much as a saucer catches fluid
from an overflowing cup) is shaded in medium blue diagonal stripes orthogonal
to the cyan stripes. The solid shading underneath reflects shading
from a "Triangulated Irregular Network (TIN)" formed in the GIS from the
City contour map (contour interval of five feet). Look at the intersection
of Liberty and the Allen Creek floodway. Look east to Ashley, where
the TIN turns green. Now look to the west, to Fourth, where the TIN
once again turns green. The rise to the east is much sharper than
is the rise to the west. Thus, the rise of Liberty to the east, to
Ashley, serves as a dam, forcing water farther to the west. Look
at how many structures there are to the west! This small example,
when carefully realized as VR (coupled with sound effects) and played out
in the CAVE and elsewhere, might have the power to convince municipal authorities
in Ann Arbor to make policy decisions involving floodplain management that
could have positive long-run implications in terms of human welfare and
safe-guarding of infrastructure and property...consider the recent case
in New Orleans...
Students will be provided
with basic geometry formed in a GIS to be manipulated using VRML-Pad or
3D Studio Max. That geometry will be formed from city maps, by the
lead faculty member, using GIS to analyze city files and to produce both
flat maps and vrml files directly from the GIS.
The creation of a virtual
downtown has environmental and public policy implications in a number of
directions. Build on existing successful work that has already seen
substantial use
by the City of Ann Arbor municipal government.
-
General models have seen
substantial use by the Downtown Residential Task Force of the City of Ann
Arbor. For the purposes of studying height in the downtown, a general,
approximate model was sufficient for initial guidelines.
-
Students in ENG477 over the
past two years have worked on applying textures to the general model and
in improving its accuracy. A sample is shown as a static image below
(a view looking east on Liberty Street: the intersection with the
traffic light is Main and Liberty). This screen capture is from the
model created by Kwon, Lazzaro, Oppenheim, and Rosenblum, and modified
by Beier. To find others, follow the link above.
With these virtual models
already in place, and aligned with one another and with the City coordinate
system (in one
setup), we now wish to move forward and apply the existing detailed
models in one or more water management scenarios, tailored to City and
to student interests. We encourage use and refinement of existing
models with the focus on getting detailed models of water management in
the downtown, including sound, to play out in the CAVE, on the GeoWall,
and on the web, with invitations to appropriate members of the municipal
government to view the final output.
-
The model is a good use of
Virtual Reality because it meets the following "Criteria for VR Applications"
(from Prof. Beier's lecture notes) although it meets some more clearly
than it meets others:
-
Complex, Three-Dimensional
Geometry
understanding, evaluation,
error detection, exploration of alternatives
-
Complex Behavior and Functionality
dynamic processes, simulation,
training, understanding, evaluation, error detection, exploration of alternatives
-
Non-Existing or Not-Yet-Existing
Worlds
planning in general, virtual
prototypes, past or future objects, places and events, creative work of
abstract nature (insofar, perhaps, as ordinance revision and other revision
of city or legal code, involving air rights and other issues, could eventually
become involved).
-
Invisible or Hidden Worlds
(water management that cannot
be seen but only imagined).
-
Remote Locations
(adding height in the downtown
may come about, in part, as a result of purchasing development rights elsewhere
to conserve green space outside town)
-
Dangerous Situations:
sound will serve as an important added audio descriptor
-
Preservation of Resources
-
Cost and Time Savings
-
Communication, Demonstration,
Promotion
-
Excitement and Fun
-
Steps that will continue
beyond this term involve
-
Completion of the detailed
and general models
-
Implementation of the models,
by the City, in a systematic manner.
-
Continued effort to gain
funding of work.
-
Extension to other communities
of the materials generated for Ann Arbor.