|
Putting Stars On The Web
| |
| Getting the Data |
|
Getting my data was fairly simple.
I contacted an old professor of mine who directed me to a web
site where I could extract the data I needed. Click view
to see how to find the data. I downloaded it as an excel
worksheet. |
| View |
| Preparing ArcView for Data |
|
In Start->All Programs->GIS Applications->ArcView
GIS3.2 you will find the ArcView GIS 3.2 application. Open
it. It will ask you if you want to open it with a new view.
Say yes. It will ask you if you wish to create a new project
with a new view. Say yes. It will ask you if you want to add
data now. Say yes. Find and open s:\caen\esri\esridata\world\world30.shp.
To get a spherical projection of the world, goto View->Properties->Projections
and select Projections of the World, the World from Space.
Now select View->Full Extent and you will be able to see
a graph of the world.
Unfortunately, the world you will see will be blue, which
is difficult to see stars on. Double click on World30.shp
and then on the fill box. If you just don't fill, you will
get a nice white background on which to place your stars.
|
| Importing Data into ArcView |
|
The first step in importing your
data is massaging it in Excel (ArcView likes longitude to be
between -180 and 180, but the data gives it between 0 and 360),
and saving it as a .dbf file. You need to be careful to format
the numbers as decimal numbers or ArcView will truncate them
to integers (or worse).
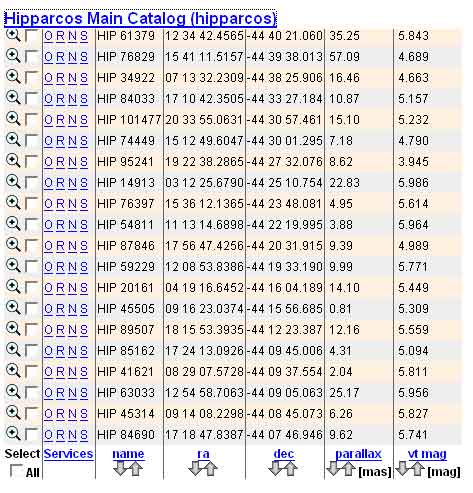
The second step in creating a good star map is to import the
data into ArcView. Goto the .apr window in ArcView. Click
on Tables. Click on add. Find your file.
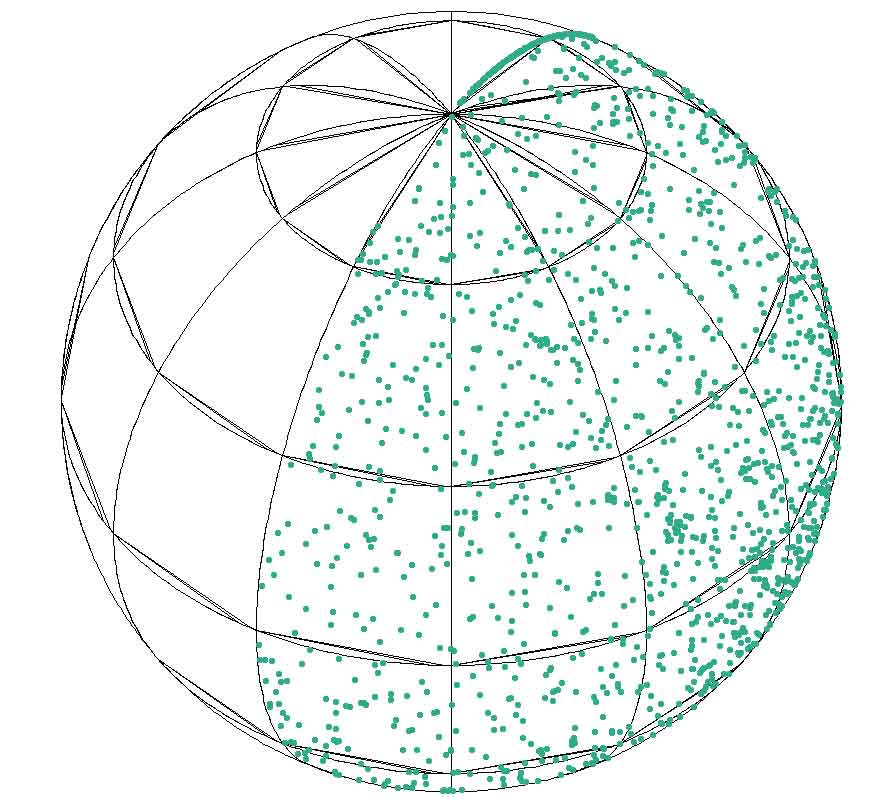
Now the data is in ArcView, but ArcView won't display it yet.
Click on your view. View->Add Event Theme. Now
choose your table, and assign x to ra and y to dec. Ra
stands for Right Ascension and is like longitude. Dec
stands for Declination and is like latitude. Now, when
you click on the box next to your file in the view window, stars
appear!
|
| View |
| Making a Map 3-D |
|
I did take a look at making my star chart 3-D, but it seems
that in order to do that, one must first create a two dimensional
projection of the map. A third characteristic (in my case,
distance in parsecs) is then used to raise features from the
plane of the map. This loses the angular information which
is important in stellar positions.
In a future exploration, I may play with this more to see
if there isn't a way to project in three dimensions directly
from the spherical coordinates.
|
| Choosing the Correct Map |
|
I stole this from http://aa.usno.navy.mil/. It calculates
the proper star chart to use.
|
| View |
|
|
|