The Continuing Search

In the years following these initial results the search for matter instability was broadened to include monopole catalysis of nucleon decay, neutron-antineutron oscillations, and nucleon decay into a multitude (30-40) different modes. The lifetime limits for some modes were pushed beyond 10^33 years. (See Physical Review Letters 57 1986 (1986))

Since some of the rare decay modes would give rise to much less Cherenkov light than the canonical (e+,pi0) mode it was obvious that the search for such decays would be facilitated by increasing the detector's light sensitivity.

A proposal to do this was presented to the Department of Energy in the fall of 1983.
The proposal was approved in the summer of 1984 and over the next two years we replaced the original five-inch PMT's with 2048 eight-inch PMT's embedded in wave-shifter plates.

By September of 1986 we were taking data with four times the sensitivity of the original detector. This allowed us to set the trigger threshold down to 40 MeV,
about a factor of 25 below the signal that would be produced by the (e+,pi0) mode.

Little did we know that a few months later we were in for a big surprise.....
a surprise we would have missed if we hadn't upgraded our light sensitivity.

The surprise had not to do with matter instability but with the
gravitational
instability of massive stars.


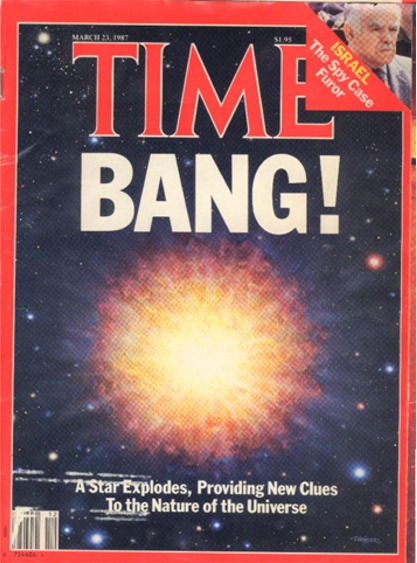
Supernova 1987a

On the night of February 23, 1987 astronomers saw something they hadn't seen for 400 years...
a supernova explosion close enough to be seen with the naked eye. A massive "blue giant"
star, 50 times as large as our sun, had exploded in the Large Magellenic Cloud (a small suburb
of our galaxy). The explosion actually occurred 170,000 years before...
it took that long for the light to get here.

When a large star has burned up all of the nuclear
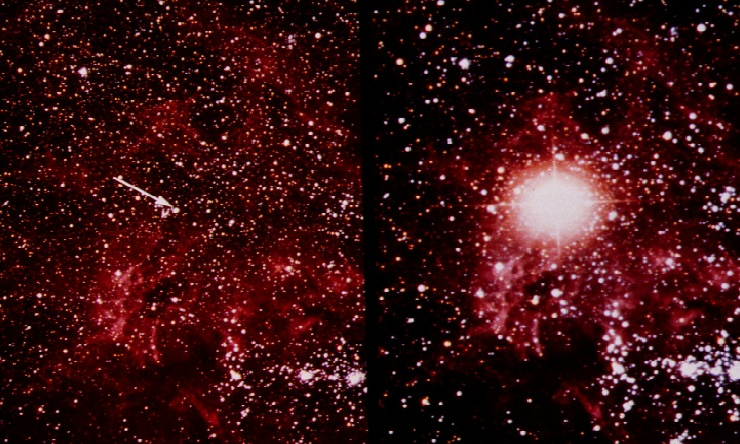
 fuel in it's center it becomes,
in a few seconds, an almost empty shell and suddenly collapses.
The rebounding matter and energy becomes a very dense, and very bright, source of light.
Suddenly the object becomes hundreds of time brighter than its progenitor star.

The "before" and "after" pictures for SN1987a are shown below.


The arrow on the left shows the progenitor star, Sanduleak -69 202.
The picture at right shows it shortly after the explosion
during which it increased its luminosity by a factor of 100 million.
(Most of the other bright objects in the photo are ordinary stars like our sun.)

During the first few seconds of such an explosion the temperature near the center is so
hot (10^10 deg) that huge numbers of neutrinos, electrons, and photons are created.
The weakly interacting neutrinos are the only ones that can escape easily so they carry away
most of the explosion energy.

The number of neutrinos emitted is extremely large... about 10^57 escape in a few seconds.
After 170,000 years this pulse of neutrinos is spread out over the surface of a sphere
170,000 light-years in radius.... big enough to encompass our whole galaxy.

Spreading out the 10^57 neutrinos over the surface of this huge sphere gives 10^13 neutrinos
per square meter. All of the neutrinos are contained in a thin shell on the surface. The shell is only
a few light-seconds thick (about the distance from here to the moon).

Of the 10^16 neutrinos that went through the IMB tank only 8 interacted with enough energy
to be detected.... all near the lower limit of our energy threshold.
The normal rate of events from atmospheric neutrinos at these low energies was only about one
per week, so seeing 8 in a few seconds meant something truly unique had happened.


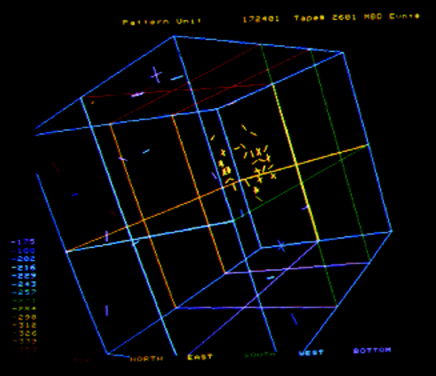
Pictures of one of the events in the IMB detector are shown below.

To see pictures of all eight of the events click here


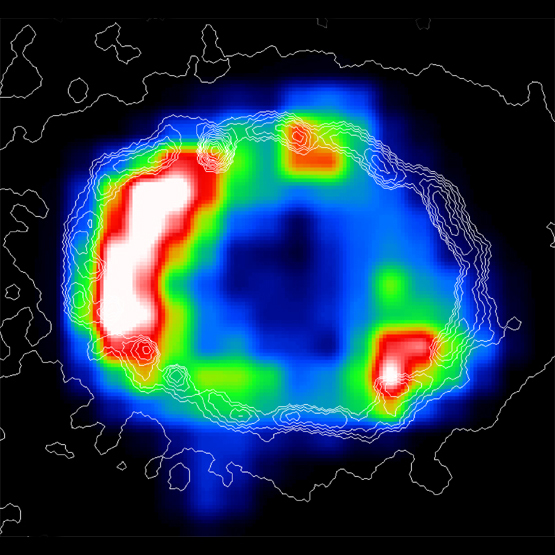
This shows the pattern of PMT hits on the back (northeast corner). A 30 MeV neutrino interacted with a proton in the water, producing a 28 MeV positron which caused the PMT's to light up. (The blue and purple PMT hits are random noise.)

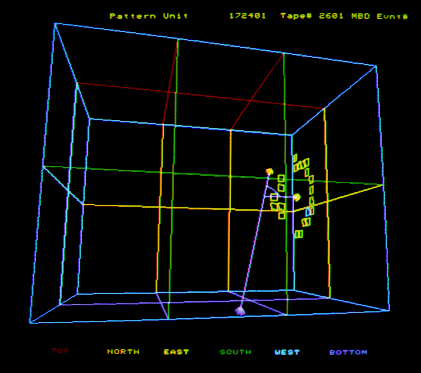
In this view the long purple line is the known neutrino direction coming from the Large Magellenic Cloud. The short purple line going right is the positron direction and the yellow squares show where its Cherenkov cone hit the north and east walls.


When one considers that this pulse of neutrinos had been racing towards us at the speed of light
for 170,000 years and that we were ready for it only a few months ahead of time.....
it has to be called luck of the purest form.
But then, as they say, timing is everything.

Another 11 events, similar to those in IMB, were detected deep underground
in Japan's Kamiokande detector at the same time.

These two experiments were the first to see neutrinos from a supernova.
Hopefully they wont be the last, but it could well be another hundred years before one
explodes close enough to be recorded in neutrinos.

These events gave a remarkable confirmation of theoretical models of the physics of supernovae.
They also allowed unique measurements of the mass, lifetime, and velocity of neutrinos.


Meanwhile, the pulse of neutrinos from Sanduleak continues, at the speed of light,
on its merry way through our Milky Way galaxy....
perhaps tripping off other detectors being watched by other civilizations.

In another 100,000 years it will have passed all of the 10 billion suns in our galaxy
( with their 10 billion "earths" ?)
and become too weak to be seen in some other faraway galaxy.


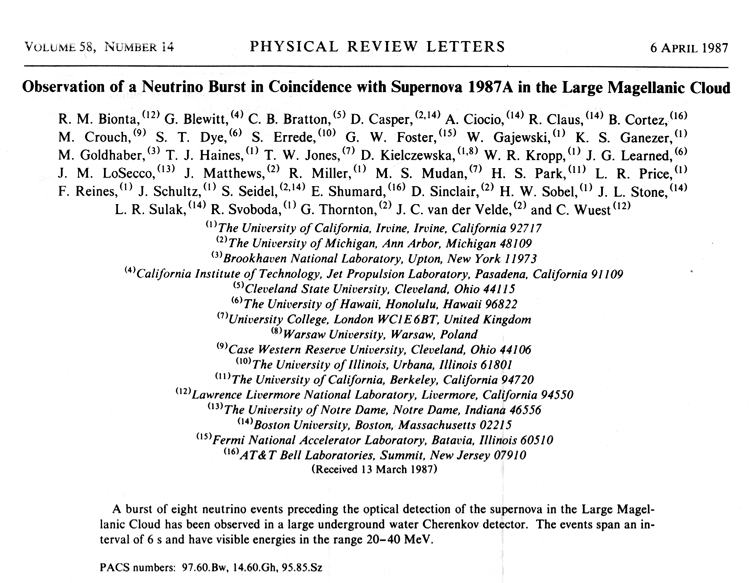
Below is the title page of the announcement of SN1987a


More details can be found in Physical Review D37 3361(1988)


For more pictures click here

and search for "Vander Velde"

Not since the year 1604 had astronomers observed a supernova this close to earth. That one probably gave inspiration to Galileo to develop the telescope, which he did, four years later.

No wonder, then, that SN1987a made the cover of Time Magazine on March 23, 1987.


This event has given us a wealth of information about the physics of supernova explosions.


The expanding shell, now over one light-year in diameter, is still being carefully studied. It's shown at right in January, 2000. The colors represent X-ray intensity as seen by the Chandra satellite. The white lines are contours of visible light as seen by the Hubble telescope.


Go to top of:

Page 1
Page 2
Page 3
This page(4)